Fig. 7
Download original image
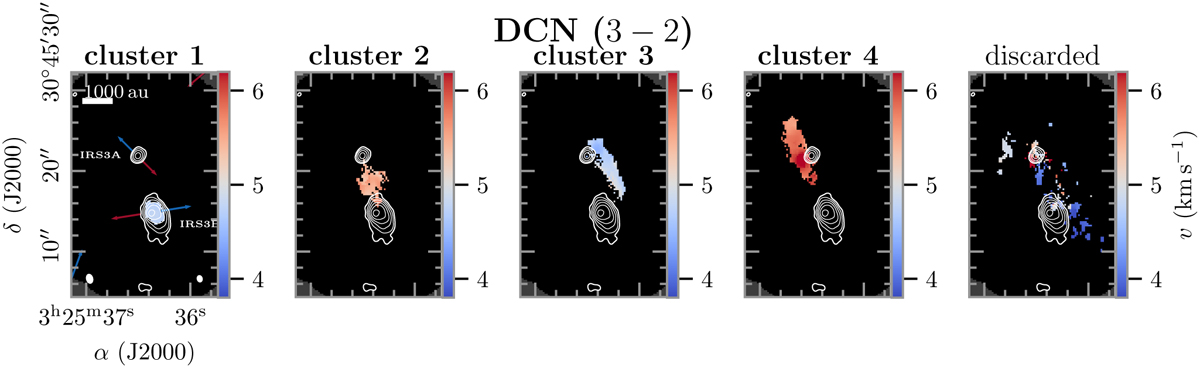
Velocity clusters derived with DBSCAN for DCN (3–2). The velocity of a cluster is shown in each panel in color, and the discarded data points are shown in the last panel. The 1.4 mm continuum data are presented in white contours, and the levels are 5, 10, 20, 40, 80, and 160×σcont (σcont=0.94mJy beam−1). In the first panel, the outflow directions are indicated and the sources are marked. A scale bar of 1000au is shown in the top left corner. The synthesized beam of the line and continuum data is shown in the bottom left and right panels, respectively. The velocity clusters for HC3N and CH3 OH are presented in Fig. C.2. The corresponding amplitude Ipeak and FWHM line width ∆3 of all three transitions are presented in Figs. C.3 and C.4, respectively.
Current usage metrics show cumulative count of Article Views (full-text article views including HTML views, PDF and ePub downloads, according to the available data) and Abstracts Views on Vision4Press platform.
Data correspond to usage on the plateform after 2015. The current usage metrics is available 48-96 hours after online publication and is updated daily on week days.
Initial download of the metrics may take a while.