Fig. 5
Download original image
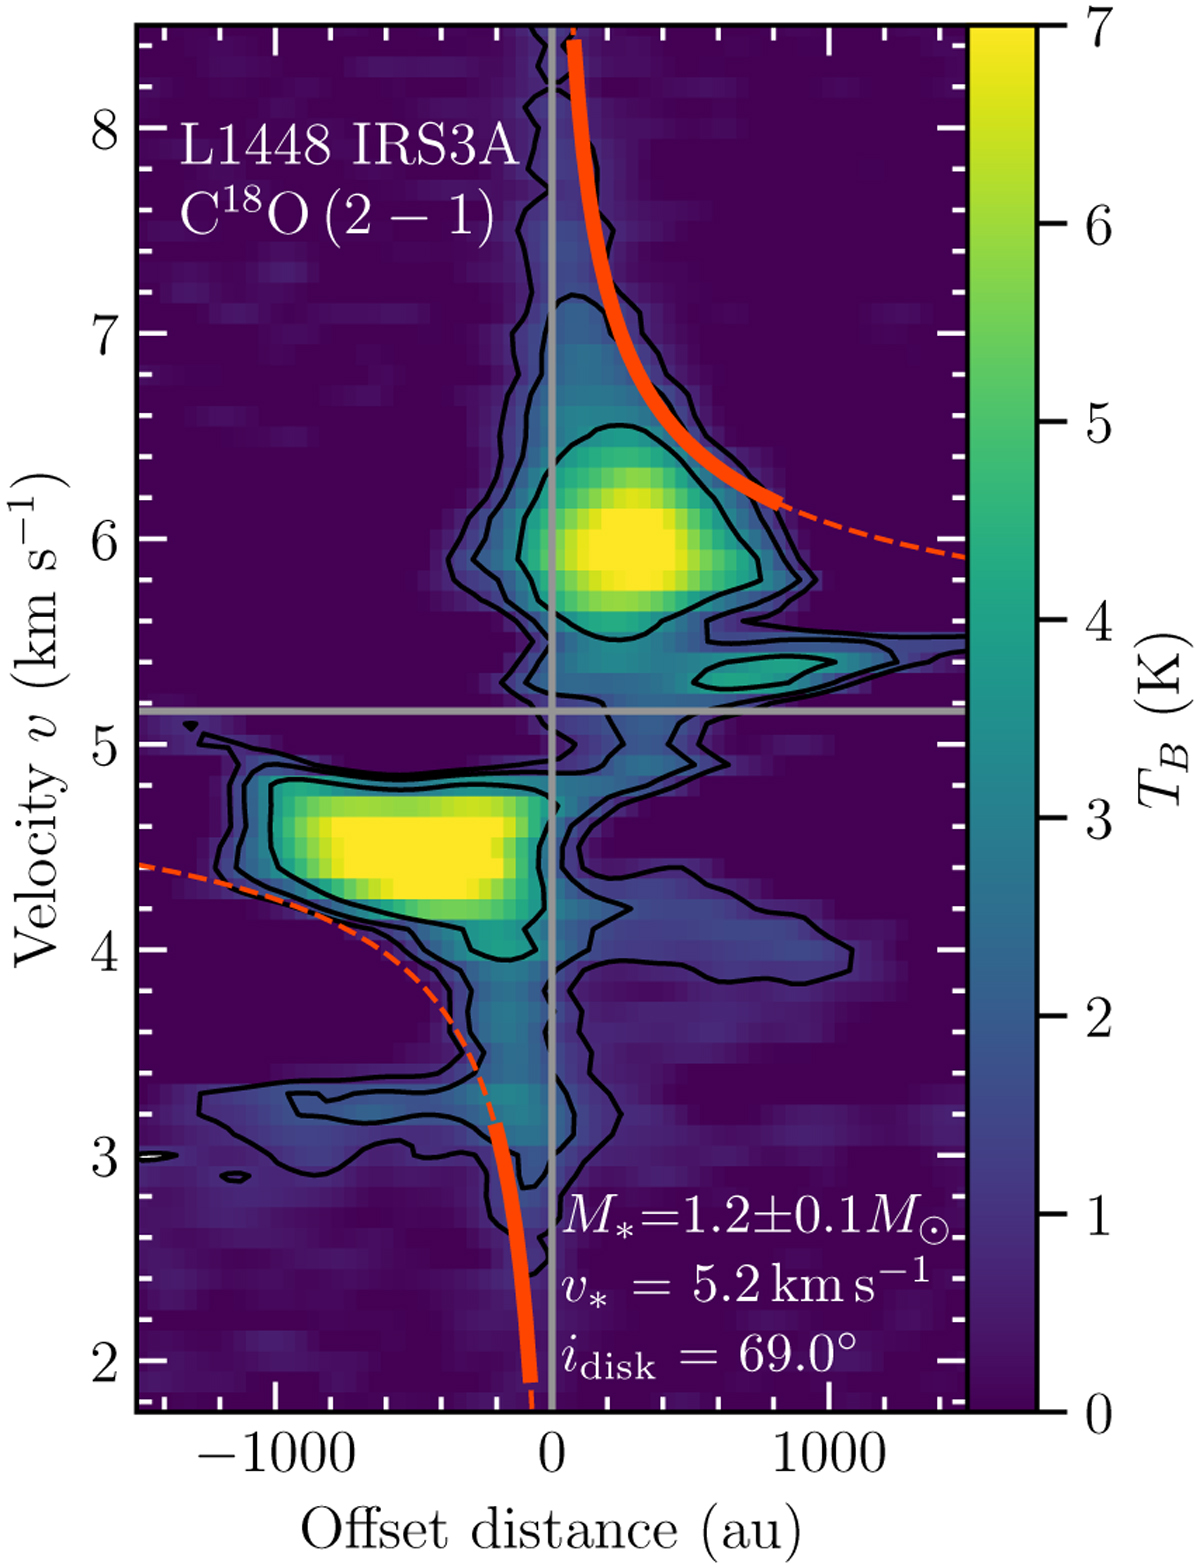
Position-velocity diagram of C18O (2–1) toward IRS3A extracted along the orientation of the disk with a width of 1″. The black contours highlight levels at 4, 8, and 16×σline (σline = 0.22 K, Table 1). The best- fit derived by KeplerFit is shown as a dashed red line. The ranges in radius that are included in the fit are indicated by the solid red line.
Current usage metrics show cumulative count of Article Views (full-text article views including HTML views, PDF and ePub downloads, according to the available data) and Abstracts Views on Vision4Press platform.
Data correspond to usage on the plateform after 2015. The current usage metrics is available 48-96 hours after online publication and is updated daily on week days.
Initial download of the metrics may take a while.