Fig. 4
Download original image
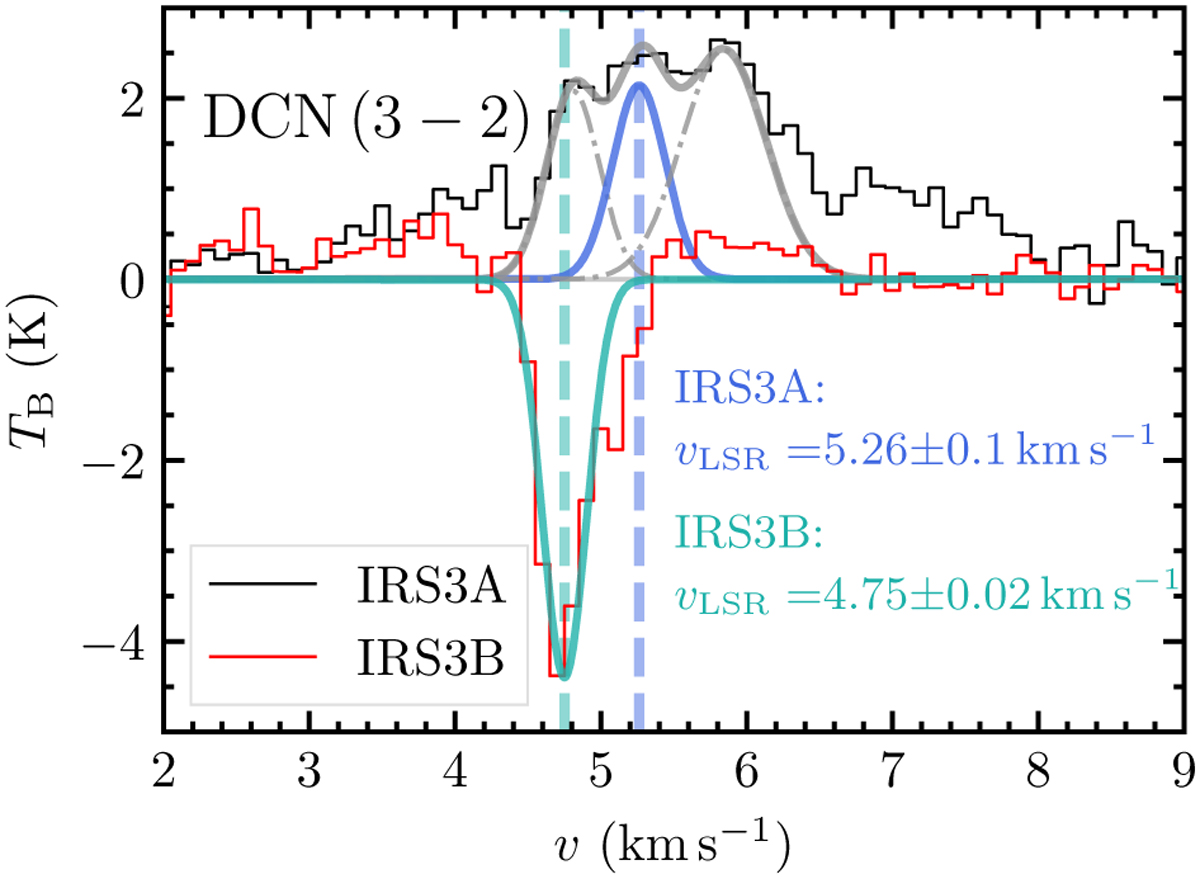
Spectrum of DCN (3–2) toward the continuum peak position of IRS3A (black) and IRS3B (red). A Gaussian fit to the central velocities is shown in blue and green, and the source velocities are indicated by vertical dashed lines for IRS3A and IRS3B, respectively. In the case of IRS3A, three components were fit in total to account for the complexity of the spectrum. The central velocity components correspond to the blue line, and the additional two components are highlighted by the dash- dotted gray lines. The total three-component fit is indicated by the solid gray line.
Current usage metrics show cumulative count of Article Views (full-text article views including HTML views, PDF and ePub downloads, according to the available data) and Abstracts Views on Vision4Press platform.
Data correspond to usage on the plateform after 2015. The current usage metrics is available 48-96 hours after online publication and is updated daily on week days.
Initial download of the metrics may take a while.