Fig. 3
Download original image
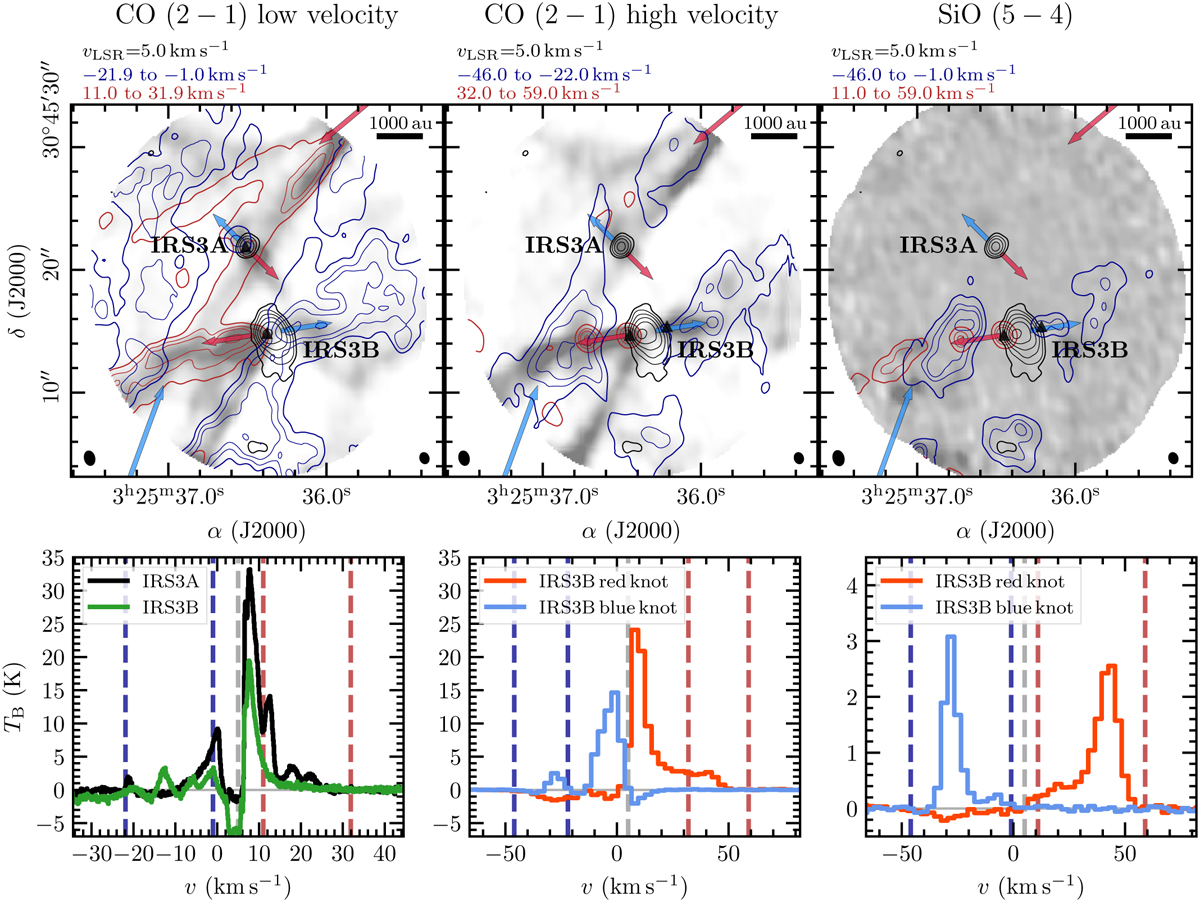
Molecular outflows in L1448N. The red and blue contours in the top panels show the red- and blueshifted line-integrated intensities of low-velocity CO 2–1 (left), high-velocity CO 2–1 (center), and SiO 5–4 (right). The contour levels are 0.1, 0.3, 0.5, and 0.9× the corresponding peak-integrated intensity. We present the integrated intensity around the source velocity in color. The integration ranges are listed in each panel and are indicated by dashed vertical red and blue lines in the spectra in the bottom panels. The outflow orientations are indicated by blue and red arrows. The black contours are the 1.4 mm continuum of the PRODIGE observations. The contour levels are 5, 10, 20, 40, 80, and 160×σcont (σcont=0.94mJy beam−1). The protostellar systems of the L1448N system (IRS3A and IRS3B) are labeled in black. The synthesized beam of the line and continuum data is indicated in the bottom left and bottom right corner, respectively. A scale bar is shown in the top right corner. The bottom panels show spectra that were extracted from the positions indicated by the black triangles in the top panels. The vertical dashed gray line is the region velocity of L1448N (≈5 km s−1).
Current usage metrics show cumulative count of Article Views (full-text article views including HTML views, PDF and ePub downloads, according to the available data) and Abstracts Views on Vision4Press platform.
Data correspond to usage on the plateform after 2015. The current usage metrics is available 48-96 hours after online publication and is updated daily on week days.
Initial download of the metrics may take a while.