Fig. 2
Download original image
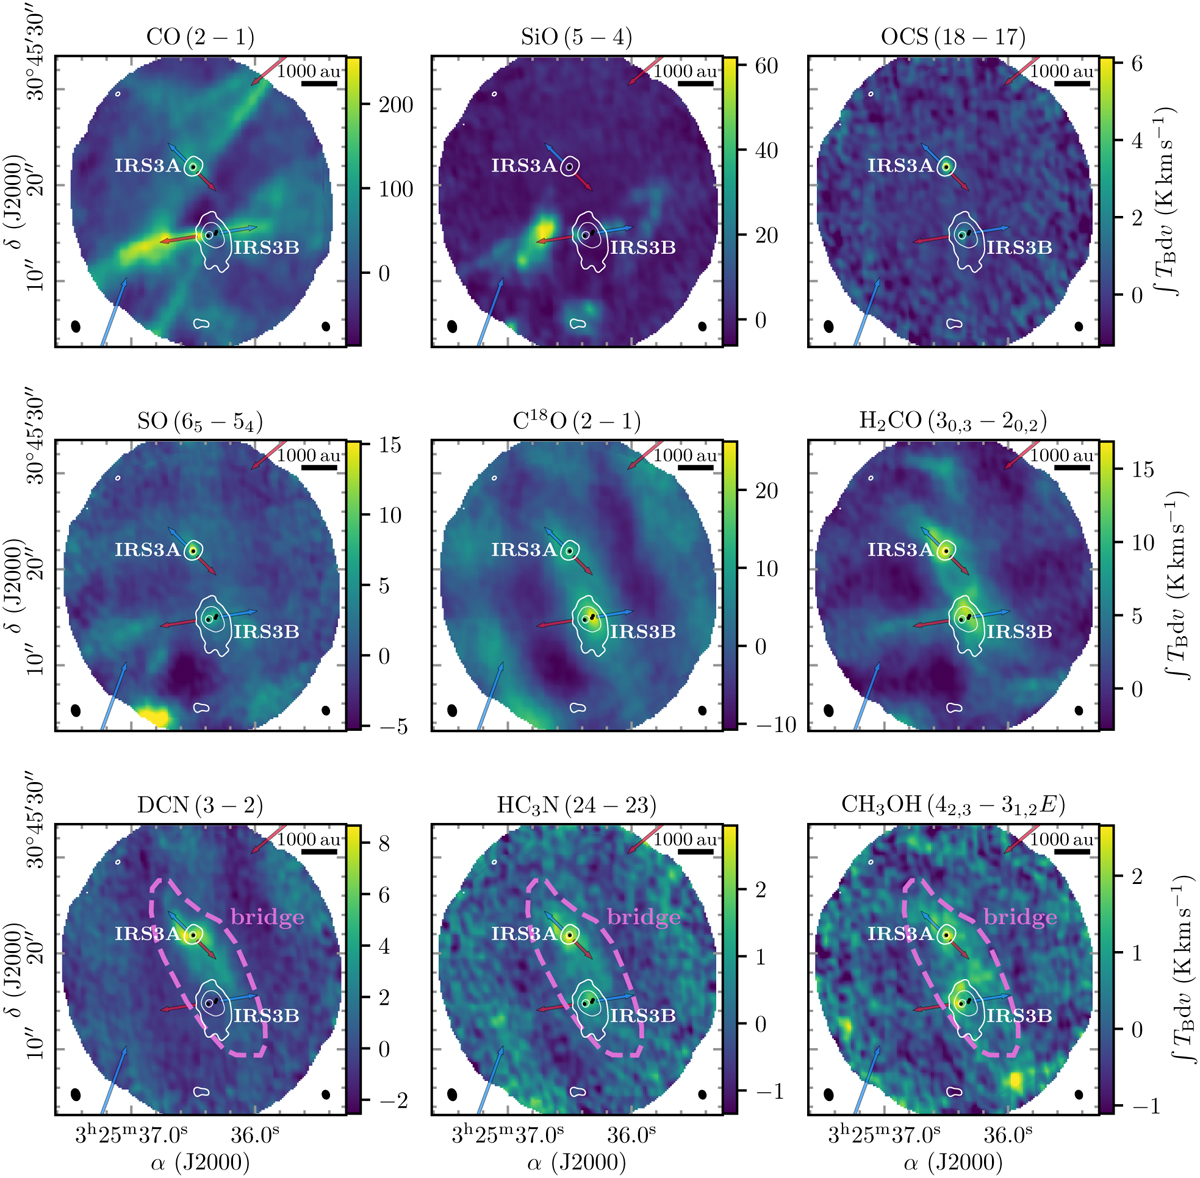
Line-integrated intensity maps of the PRODIGE observations. The line-integrated intensity and the 1.4 mm continuum are presented in color and white contours, respectively. The contour levels are 5, 40, and 160×σcont (σcont=0.94mJybeam−1). The IRS3A and IRS3B protostellar systems toward L1448N are labeled in white. The black circles mark the positions of individual protostars taken from the VANDAM survey (Tobin et al. 2016b). The bipolar outflow orientations are indicated by blue and red arrows. The synthesized beam of the line and continuum data is indicated in the bottom left and bottom right corner, respectively. A scale bar is shown in the top right corner. In the bottom row panels, the extent of the bridge structure is indicated by the dashed pink polygon. The spectra toward the continuum peak position of IRS3A and IRS3B are shown in Fig. A.1 for all transitions.
Current usage metrics show cumulative count of Article Views (full-text article views including HTML views, PDF and ePub downloads, according to the available data) and Abstracts Views on Vision4Press platform.
Data correspond to usage on the plateform after 2015. The current usage metrics is available 48-96 hours after online publication and is updated daily on week days.
Initial download of the metrics may take a while.