Fig. 4
Download original image
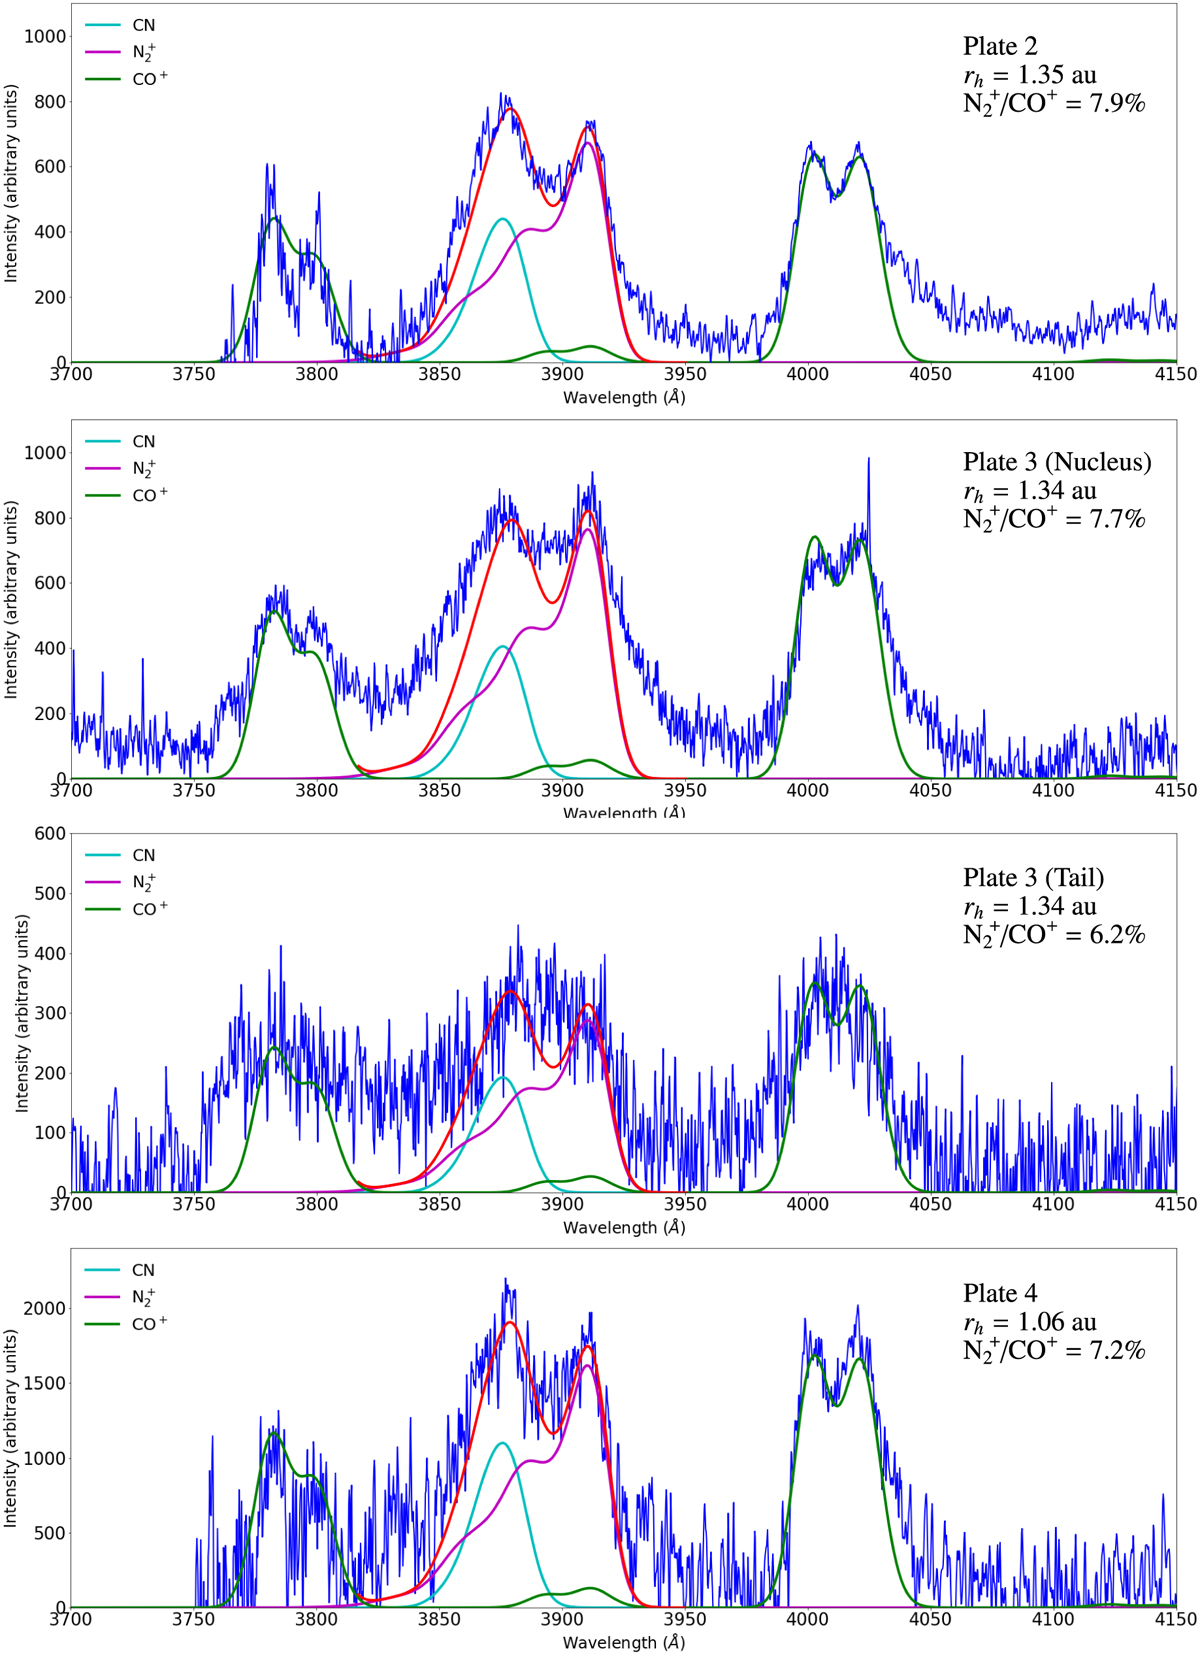
Observational spectrum (blue), after the subtraction of a (very small) solar continuum with the overall fit (red), the sum of CO+ (green), ![]() (magenta), and CN (light blue) spectra. The bands appearing around 3800 Å and 4000 Å are CO+ bands, respectively (4,0) and (3,0). Top: modeling of the spectrum extracted from plate 2 (30 October 1908). Second: modeling of the spectrum extracted from plate 3 (31 October and 1 November 1908) from the nucleus region, where the signal-to-noise is the best. Third: modeling of the spectrum from the tail region of plate 3 (31 October and 1 November 1908). This one has a larger uncertainty compared to the nucleus region because of the smaller signal-to-noise ratio. Bottom: modeling of the spectrum extracted from plate 4 (28 November 1908).
(magenta), and CN (light blue) spectra. The bands appearing around 3800 Å and 4000 Å are CO+ bands, respectively (4,0) and (3,0). Top: modeling of the spectrum extracted from plate 2 (30 October 1908). Second: modeling of the spectrum extracted from plate 3 (31 October and 1 November 1908) from the nucleus region, where the signal-to-noise is the best. Third: modeling of the spectrum from the tail region of plate 3 (31 October and 1 November 1908). This one has a larger uncertainty compared to the nucleus region because of the smaller signal-to-noise ratio. Bottom: modeling of the spectrum extracted from plate 4 (28 November 1908).
Current usage metrics show cumulative count of Article Views (full-text article views including HTML views, PDF and ePub downloads, according to the available data) and Abstracts Views on Vision4Press platform.
Data correspond to usage on the plateform after 2015. The current usage metrics is available 48-96 hours after online publication and is updated daily on week days.
Initial download of the metrics may take a while.