Fig. 2.
Download original image
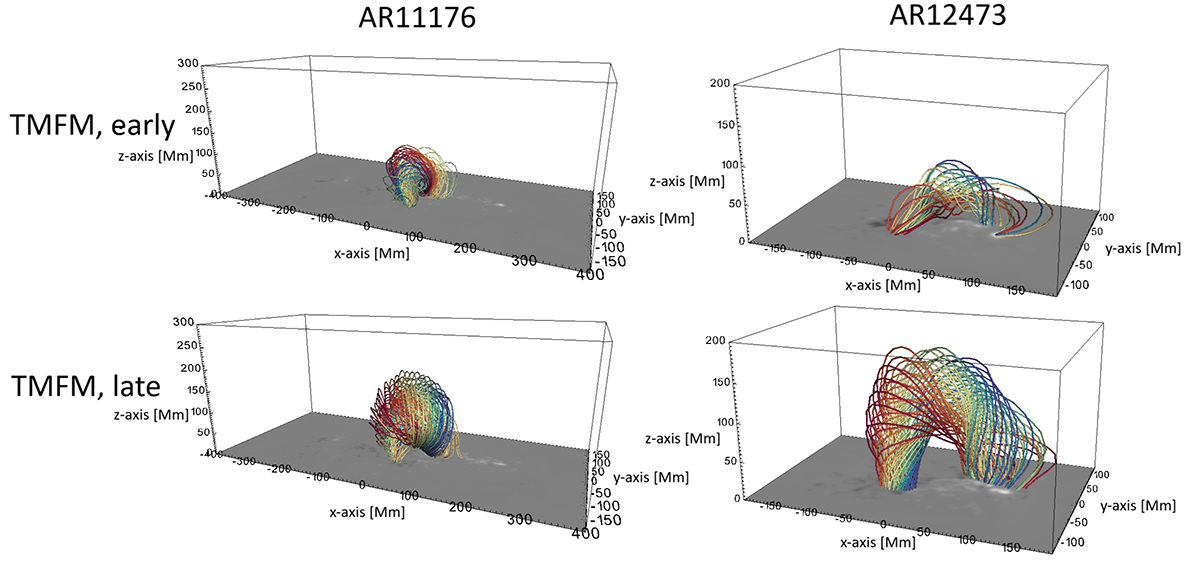
Characteristic snapshots of TMFM run of AR12473 (top) and AR11176 (bottom). Field line colouring is based on seed-point location, chosen for appropriate contrast. The Bz component of the magnetic field is plotted at the bottom boundary, with the conventional grey-scale colour scheme (positive polarity in white, negative polarity in black; the respective maximum and minimum colour values are at 0.3T and −0.3T).
Current usage metrics show cumulative count of Article Views (full-text article views including HTML views, PDF and ePub downloads, according to the available data) and Abstracts Views on Vision4Press platform.
Data correspond to usage on the plateform after 2015. The current usage metrics is available 48-96 hours after online publication and is updated daily on week days.
Initial download of the metrics may take a while.