Fig. E.3.
Download original image
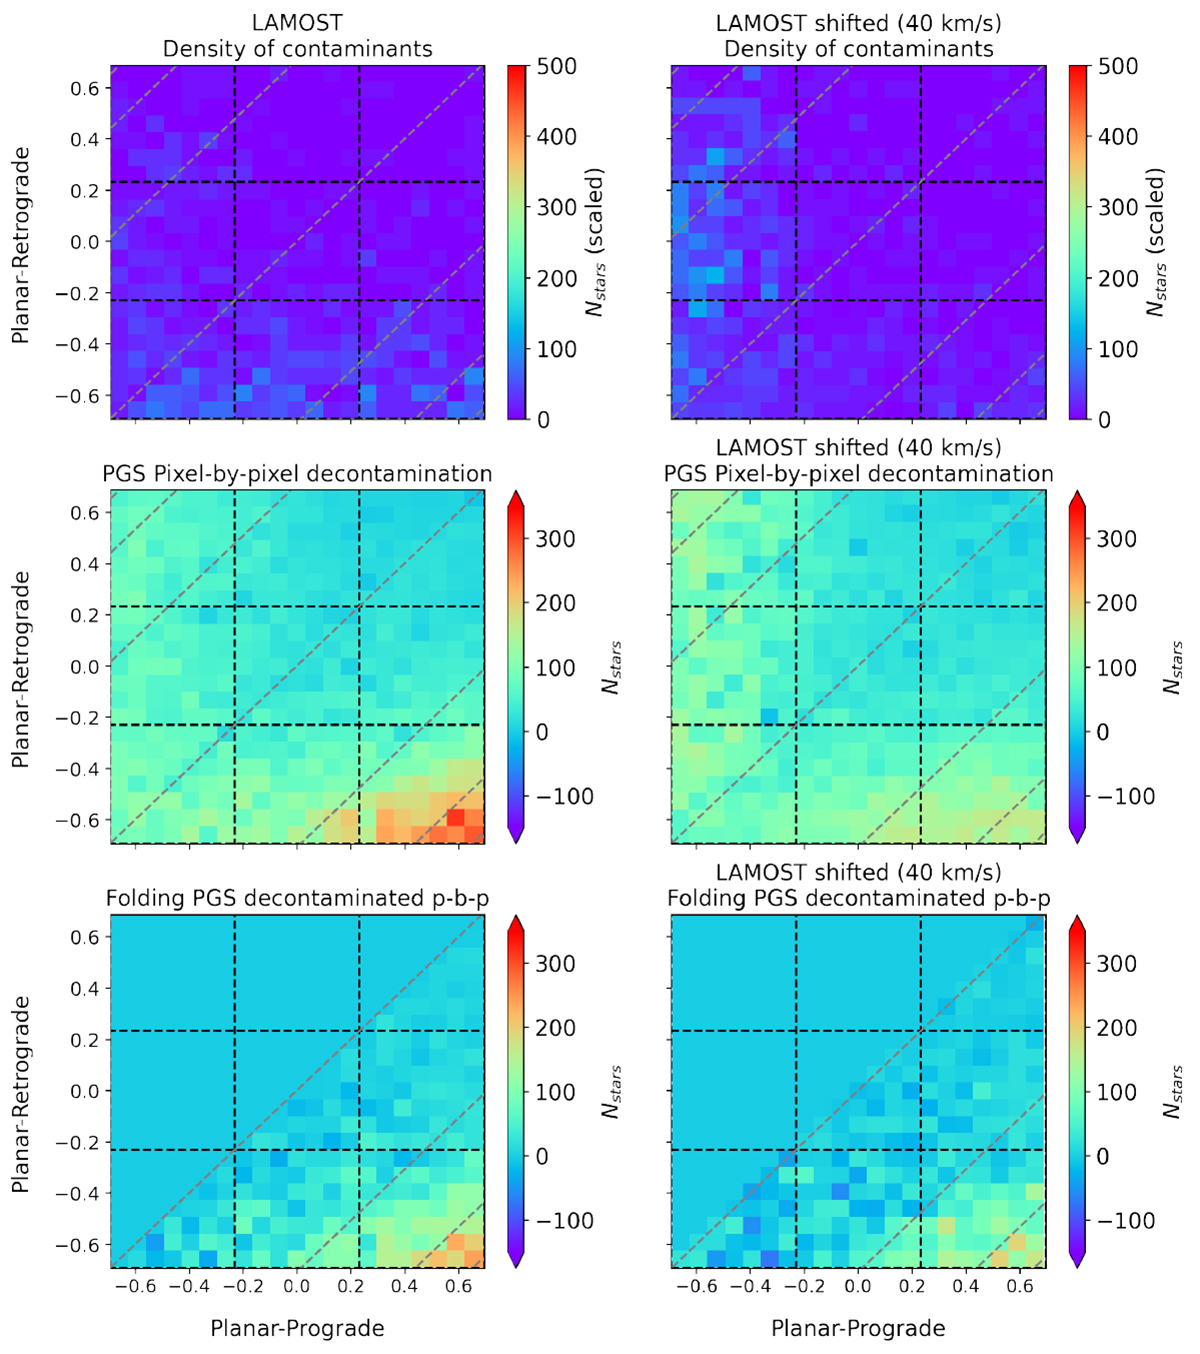
Rotated action space for metallicities between -4.0 ≤ [Fe/H] < -1.7. The grey dashed lines correspond to different values of Lz/Jtot: [-0.95, -0.8, -0.5, 0, 0.5, 0.8, 0.95]. Left column: decontamination process and folding using LAMOST contamination. Top row: density of spectroscopic contaminants. Middle row: pixel-by-pixel decontamination. Bottom row: folding of the retrograde components over the prograde components, for PGS decontaminated pixel-by-pixel. In this space, the folding axis of symmetry is the grey dashed line at Lz/Jtot = 0. Right column: same as the left panels, but the three actions were computed shifting the observed Vϕ by 40 km.s−1. Same as Fig. 15 of Sec. 6.2.
Current usage metrics show cumulative count of Article Views (full-text article views including HTML views, PDF and ePub downloads, according to the available data) and Abstracts Views on Vision4Press platform.
Data correspond to usage on the plateform after 2015. The current usage metrics is available 48-96 hours after online publication and is updated daily on week days.
Initial download of the metrics may take a while.