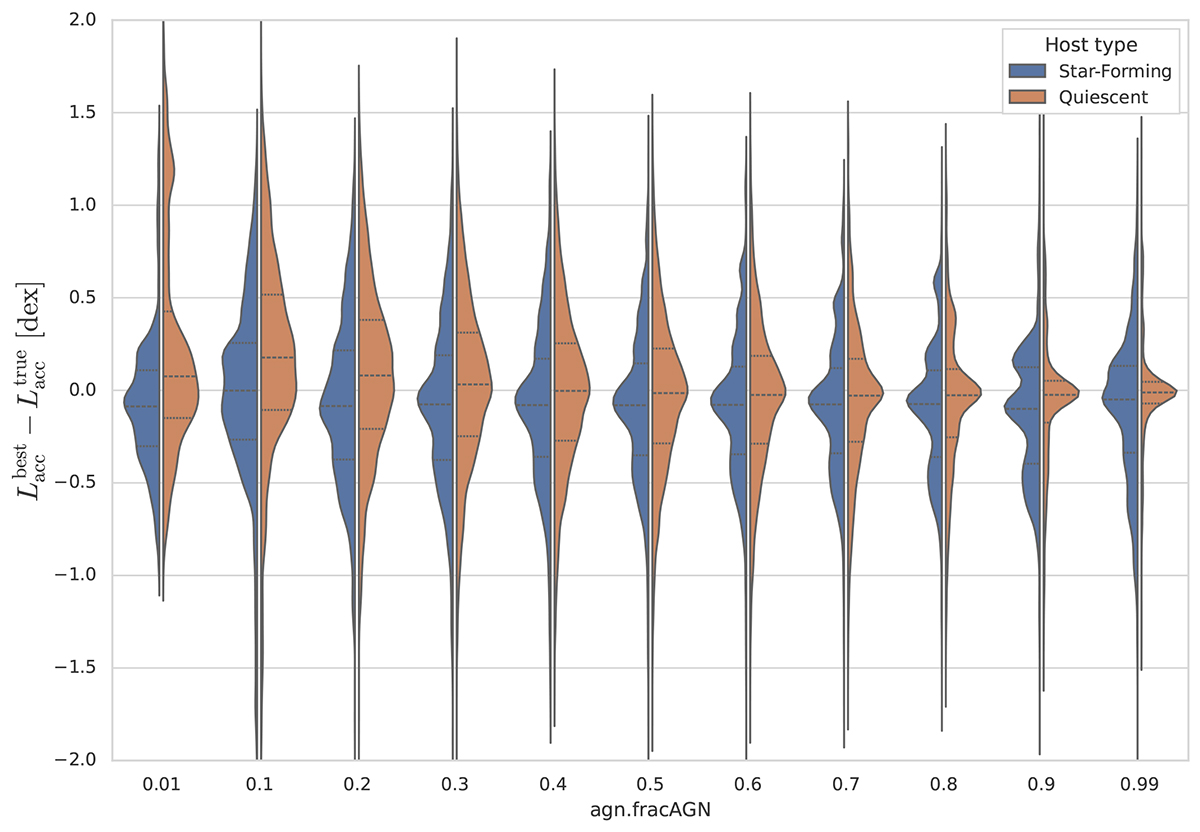
Fig. 6.
Download original image
Violin plots showing the difference between the true AGN accretion power and the fitted value. Blue represents a star-forming host galaxy with a young stellar population, while orange represents a quiescent host galaxy with an old stellar population. Dashed lines inside the violins indicate the quartiles of each distribution.
Current usage metrics show cumulative count of Article Views (full-text article views including HTML views, PDF and ePub downloads, according to the available data) and Abstracts Views on Vision4Press platform.
Data correspond to usage on the plateform after 2015. The current usage metrics is available 48-96 hours after online publication and is updated daily on week days.
Initial download of the metrics may take a while.