Fig. 20.
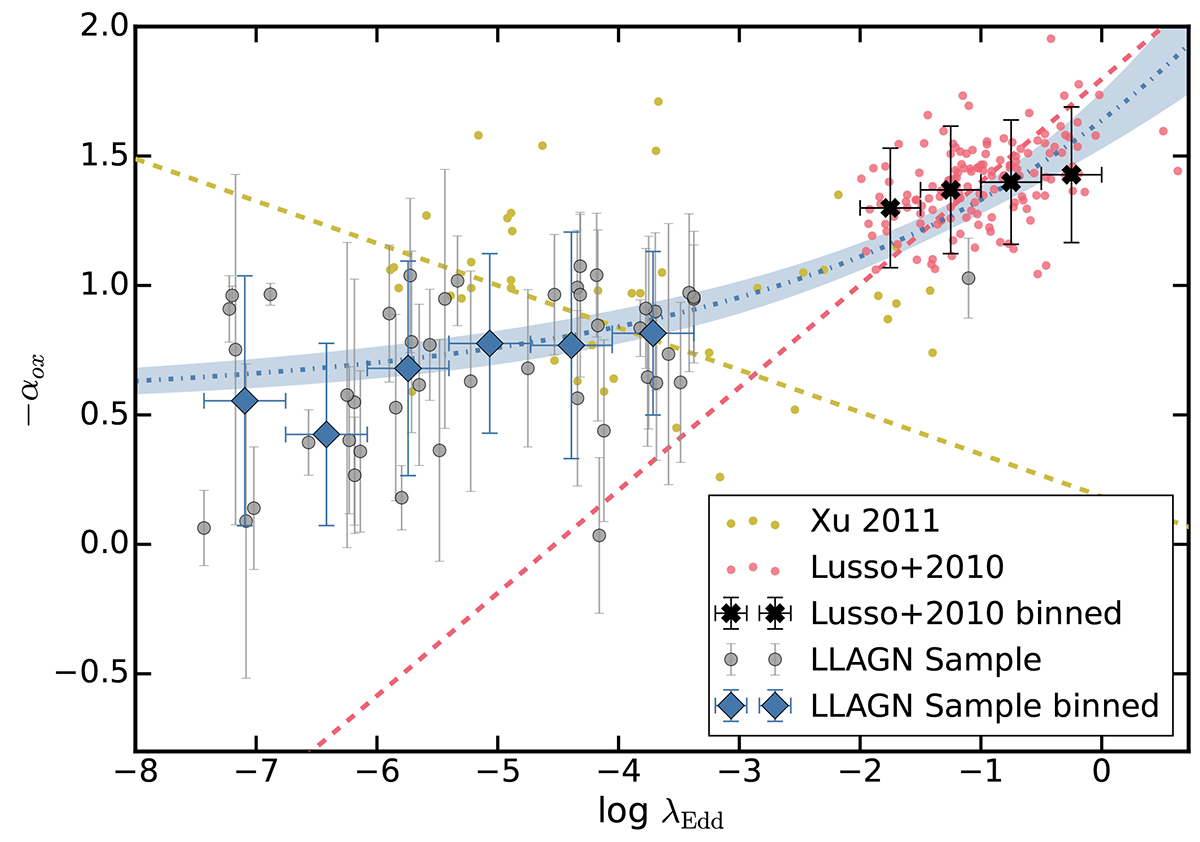
Download original image
Comparison of the spectral index αox with the Eddington ratio (λEdd). The AGN sample from Lusso et al. (2010) is represented in red, the LLAGN sample from Xu (2011) is in yellow, and our modeled values for each LLAGN source are in gray. Our binned data are depicted as blue diamonds, while the black crosses represent the binned data from Lusso et al. (2010). The dashed blue line indicates the fit to all the binned data. Contrary to the anticorrelation proposed by Xu (2011), our fit follows a constant value for the low regime. Shaded regions indicate the 1-sigma uncertainties.
Current usage metrics show cumulative count of Article Views (full-text article views including HTML views, PDF and ePub downloads, according to the available data) and Abstracts Views on Vision4Press platform.
Data correspond to usage on the plateform after 2015. The current usage metrics is available 48-96 hours after online publication and is updated daily on week days.
Initial download of the metrics may take a while.