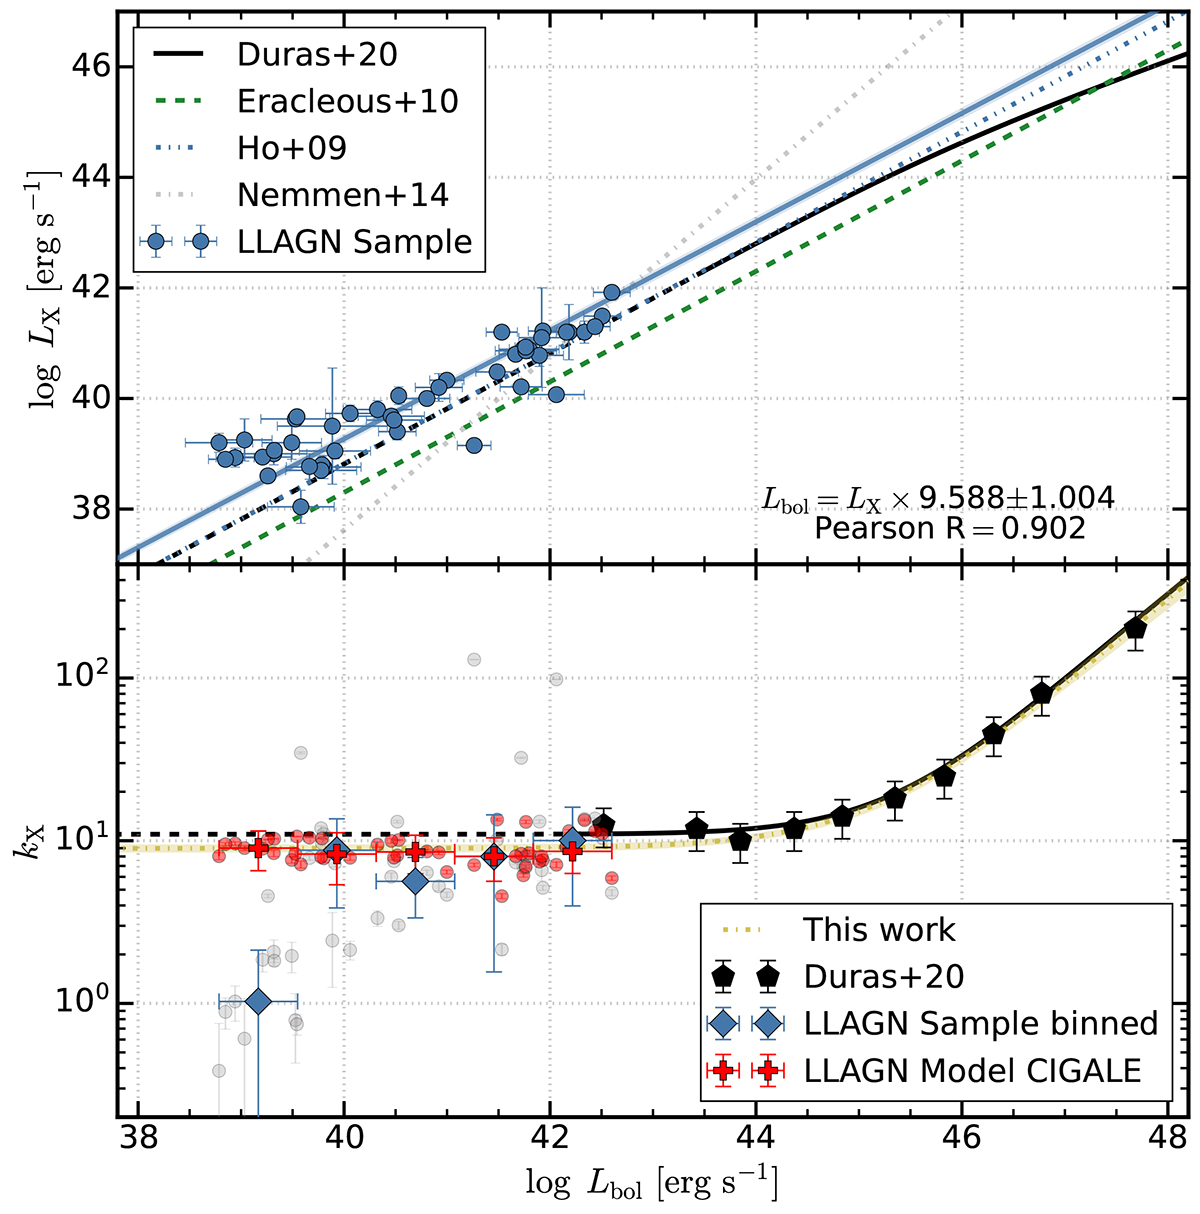
Fig. 15.
Download original image
X-ray bolometric correction on the low-luminosity regime. Upper panel: Blue dots depict the measured X-ray luminosities plotted against the bolometric luminosities for our LLAGN sample, with a blue line indicating the linear regression fitted to this data. In contrast, the data and bolometric correction from Nemmen et al. (2014) are shown as gray stars and a dotted line, respectively. The solid black line represents the bolometric correction from Duras et al. (2020), transitioning to a dotted line where it extrapolates beyond the data. Lower panel: X-ray bolometric correction (kX) plotted against bolometric luminosity. The solid black line denotes the bolometric correction from Duras et al. (2020), accompanied by black pentagons representing its binned data. Our binned data for the LLAGN sample are illustrated with blue diamonds. The dotted yellow line represents the fit to Eq. (4) using a combination of our binned data and that from Duras et al. (2020). Red crosses mark the binned data from the pure AGN X-ray luminosities modeled by CIGALE. Shaded regions indicate the 1-sigma uncertainties.
Current usage metrics show cumulative count of Article Views (full-text article views including HTML views, PDF and ePub downloads, according to the available data) and Abstracts Views on Vision4Press platform.
Data correspond to usage on the plateform after 2015. The current usage metrics is available 48-96 hours after online publication and is updated daily on week days.
Initial download of the metrics may take a while.