Fig. 12.
Download original image
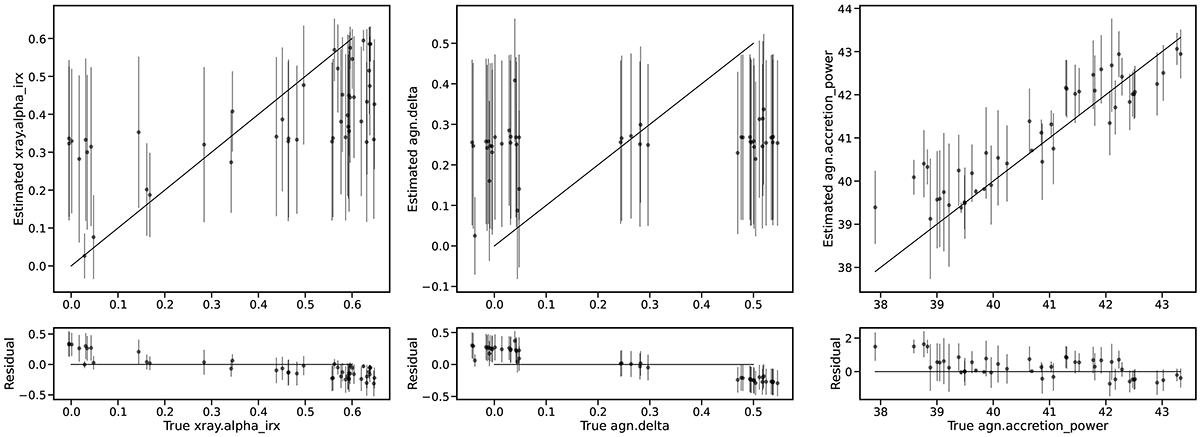
Parameters constraint analysis. The left panel shows the comparison between the true αIRX (from the best-fit SED) and the estimated values from the re-performed SED fitting. The solid black line represents the 1:1 relation, with residuals plotted at the bottom. The middle and right panels show similar comparisons for δAGN and agn.accretion_power, respectively.
Current usage metrics show cumulative count of Article Views (full-text article views including HTML views, PDF and ePub downloads, according to the available data) and Abstracts Views on Vision4Press platform.
Data correspond to usage on the plateform after 2015. The current usage metrics is available 48-96 hours after online publication and is updated daily on week days.
Initial download of the metrics may take a while.