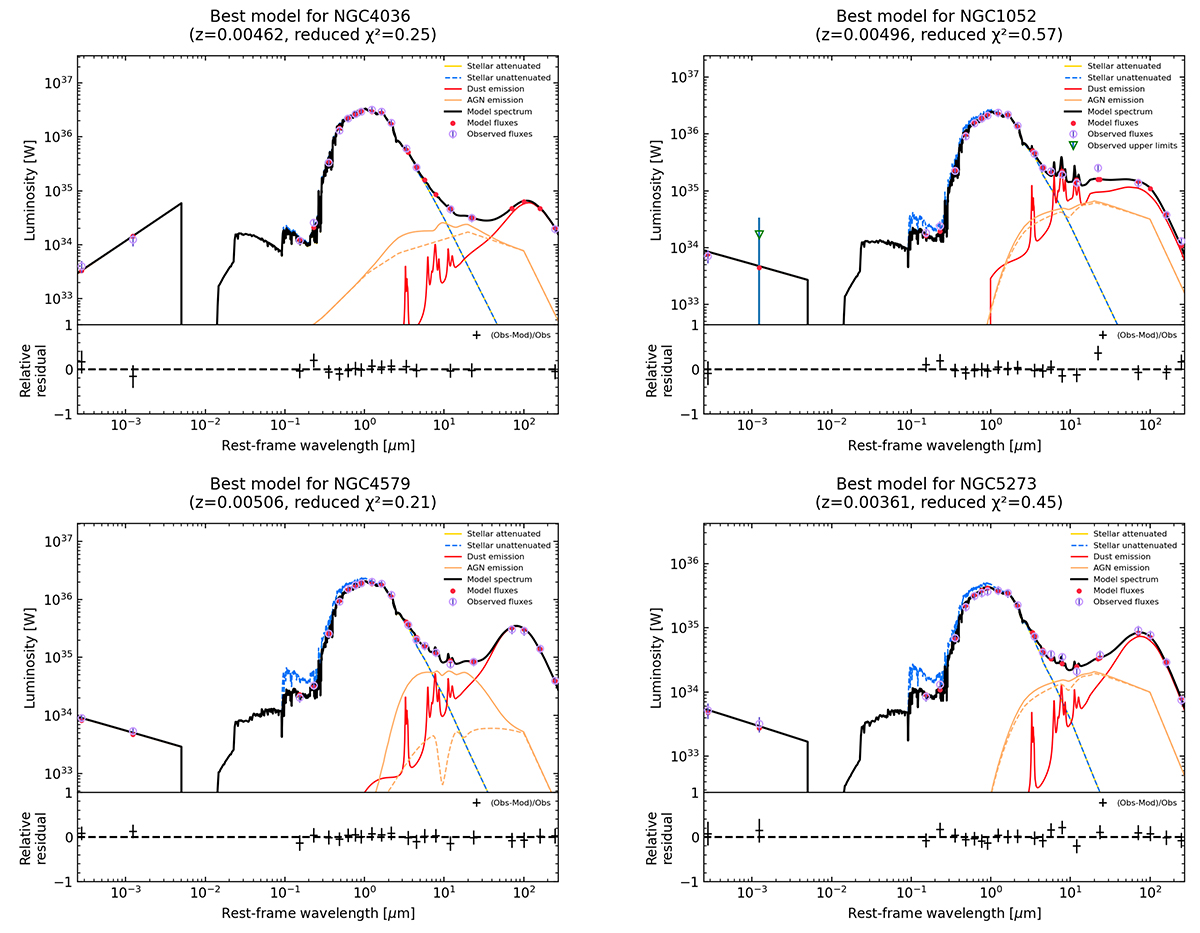
Fig. 11.
Download original image
Example of the best fit achieved with our module for the LLAGN sample. Pink circles represent the observed photometry for each band, while red dots indicate the modeled flux in each band. The black line shows the best-fit composite model, with different colors representing specific model components: yellow denotes the stellar component attenuated by host galaxy extinction, the dashed blue line is the unattenuated stellar component, the brown line shows dust re-emission and the solid orange line represents the total AGN emission. The dashed orange line indicates the attenuated central engine, and thus the difference between the dashed and solid orange lines represents torus re-emission. NGC4036 and NGC4579 are presented on the left, showcasing a direct view of the central engine (i = 10°), with NGC4579 additionally exhibiting some dust extinction in the polar direction (E(B − V)polar = 0.3). Conversely, on the right, NGC1052 and NGC5273 are depicted, illustrating an obscured view of the central engine (i = 80°), highlighting the impact of viewing angle on the observed SED characteristics.
Current usage metrics show cumulative count of Article Views (full-text article views including HTML views, PDF and ePub downloads, according to the available data) and Abstracts Views on Vision4Press platform.
Data correspond to usage on the plateform after 2015. The current usage metrics is available 48-96 hours after online publication and is updated daily on week days.
Initial download of the metrics may take a while.