Fig. 6.
Download original image
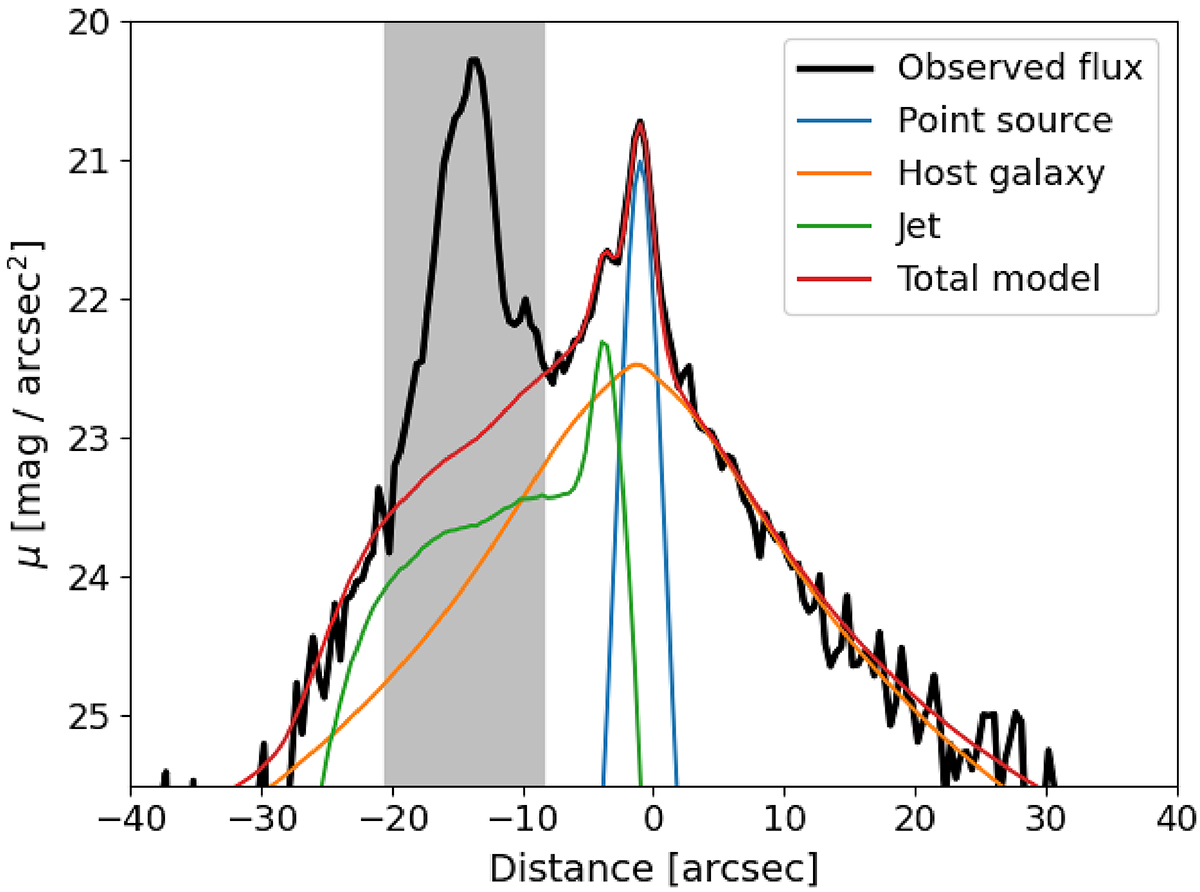
AstroSat-UVIT photometric cut of the decomposition model along the jet direction. The thick black line shows the observed flux along the cut, the blue line is the central point source, the orange line is the host galaxy, the green line is the jet total flux, and the red line is the total model flux. The shaded area shows the masked out region of the jet that has a complex fine structure that cannot be accurately modelled with a simple analytical function and was therefore excluded from the decomposition to reduce the model complexity.
Current usage metrics show cumulative count of Article Views (full-text article views including HTML views, PDF and ePub downloads, according to the available data) and Abstracts Views on Vision4Press platform.
Data correspond to usage on the plateform after 2015. The current usage metrics is available 48-96 hours after online publication and is updated daily on week days.
Initial download of the metrics may take a while.