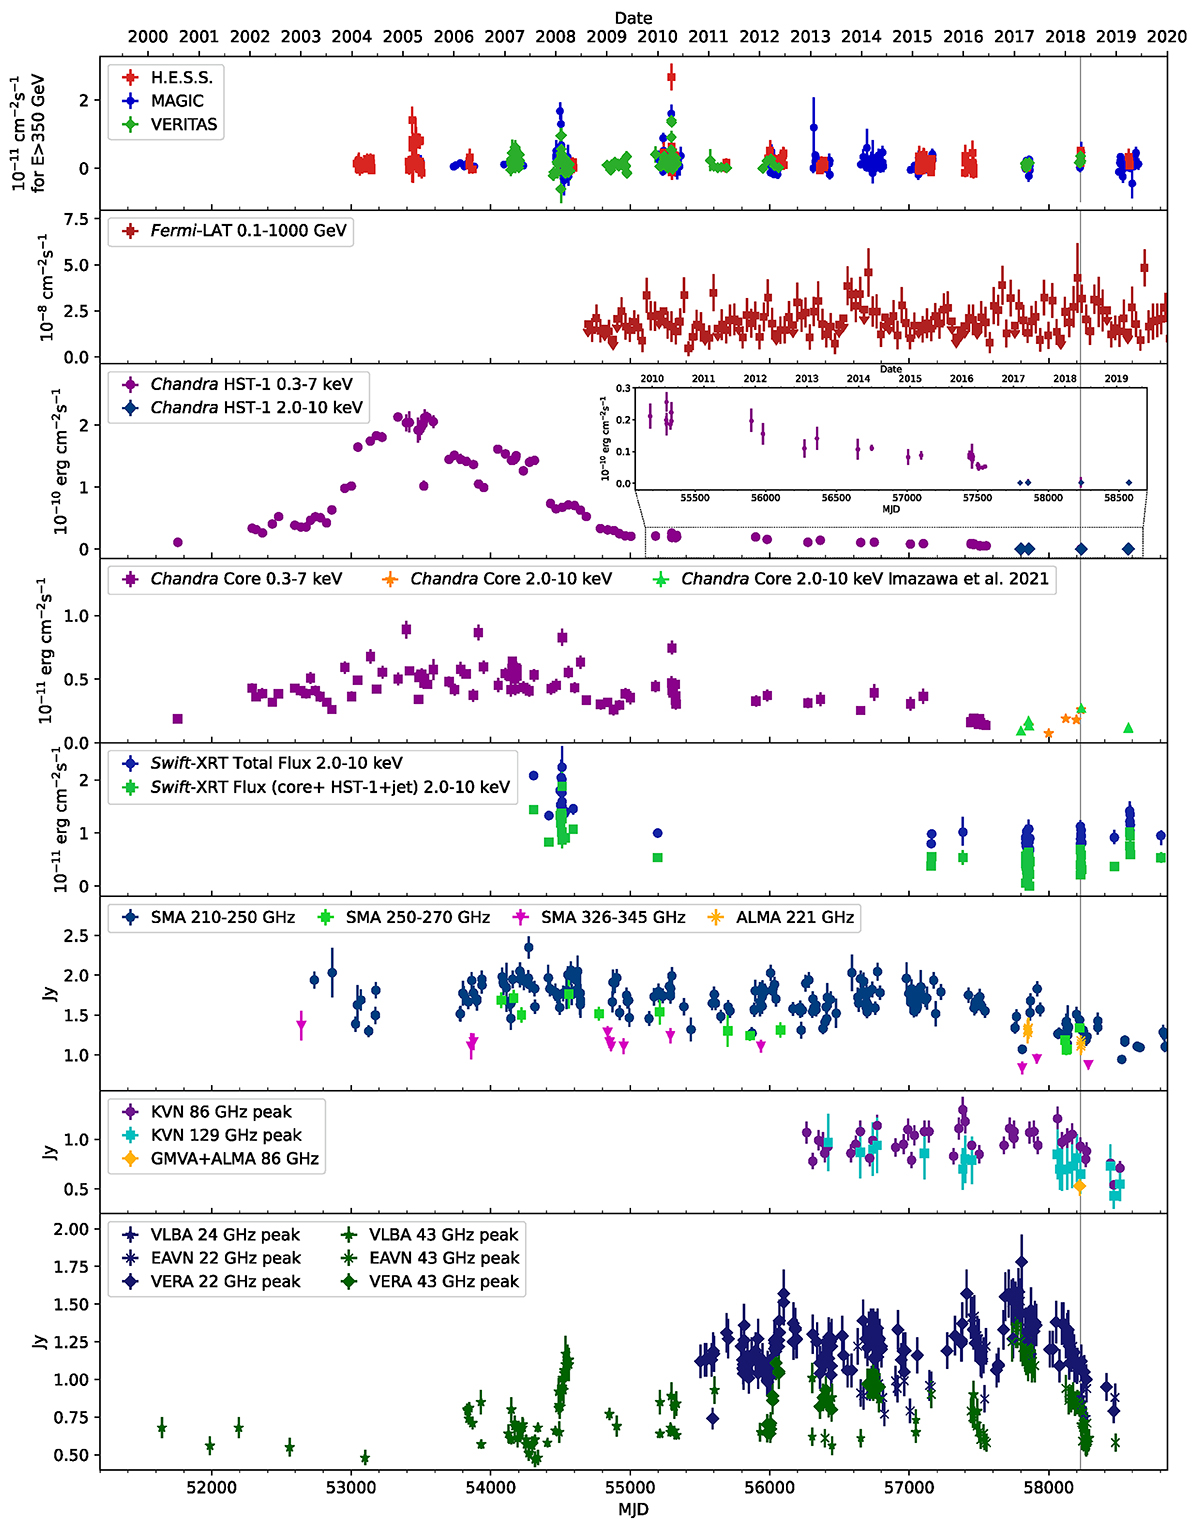
Fig. 3.
Download original image
Long-term MWL light curves of M87 from the last two decades taken by the instruments participating in the 2018 observational campaign. Here are listed the observations used in the plot and their reference (in case of already published results): Chandra (0.3–7 keV) (Sun et al. 2018), (2.0–10 keV) (Imazawa et al. 2021); MAGIC, H.E.S.S., VERITAS (2004–2011), Fermi-LAT (2008–2011), VLBA (43 GHz peak) (2006–2011) (Abramowski et al. 2012); H.E.S.S. (before April 2004, 2001–2016, after 2019) (H.E.S.S. Collaboration 2023); VERITAS (2011–2012) (Beilicke & VERITAS Collaboration 2012); VERA (2011–2012), MAGIC (2012–2015) (MAGIC Collaboration 2020); KVN (2012–2016) recalculated from Kim et al. (2018); VLBA, EAVN, VERA (2000–2018) (Cui et al. 2023); All instruments 2017 data (M87 MWL2017). We mark the VHE flare in 2018 with a grey-shaded line in the background. The inset in the third row provides a zoomed-in view of the Chandra measurement of HST-1.
Current usage metrics show cumulative count of Article Views (full-text article views including HTML views, PDF and ePub downloads, according to the available data) and Abstracts Views on Vision4Press platform.
Data correspond to usage on the plateform after 2015. The current usage metrics is available 48-96 hours after online publication and is updated daily on week days.
Initial download of the metrics may take a while.