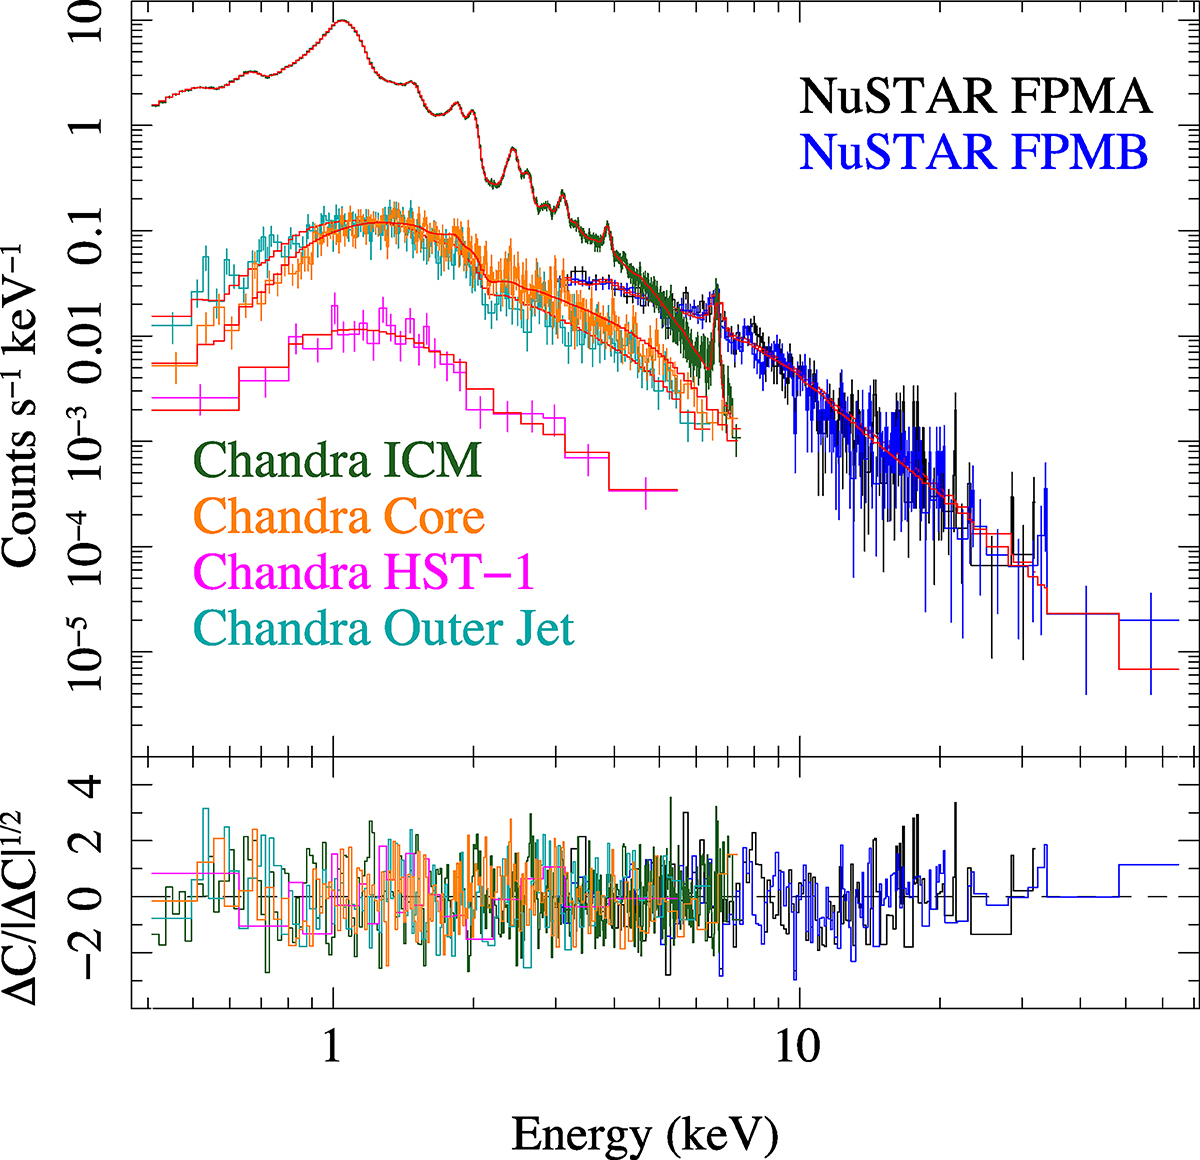
Fig. 21.
Download original image
X-ray spectra of M87 from Chandra and NuSTAR observations in April 2018. Colour-coding for the spatially resolved components is the same as in Fig. 7. The red curves represent the spatially resolved model appropriate for each dataset. The NuSTAR model is the sum of the other spatial components (with cross-normalisation constants to account for instrumental differences between NuSTAR and Chandra as well as between NuSTAR’s two focal plane modules).
Current usage metrics show cumulative count of Article Views (full-text article views including HTML views, PDF and ePub downloads, according to the available data) and Abstracts Views on Vision4Press platform.
Data correspond to usage on the plateform after 2015. The current usage metrics is available 48-96 hours after online publication and is updated daily on week days.
Initial download of the metrics may take a while.