Fig. 11.
Download original image
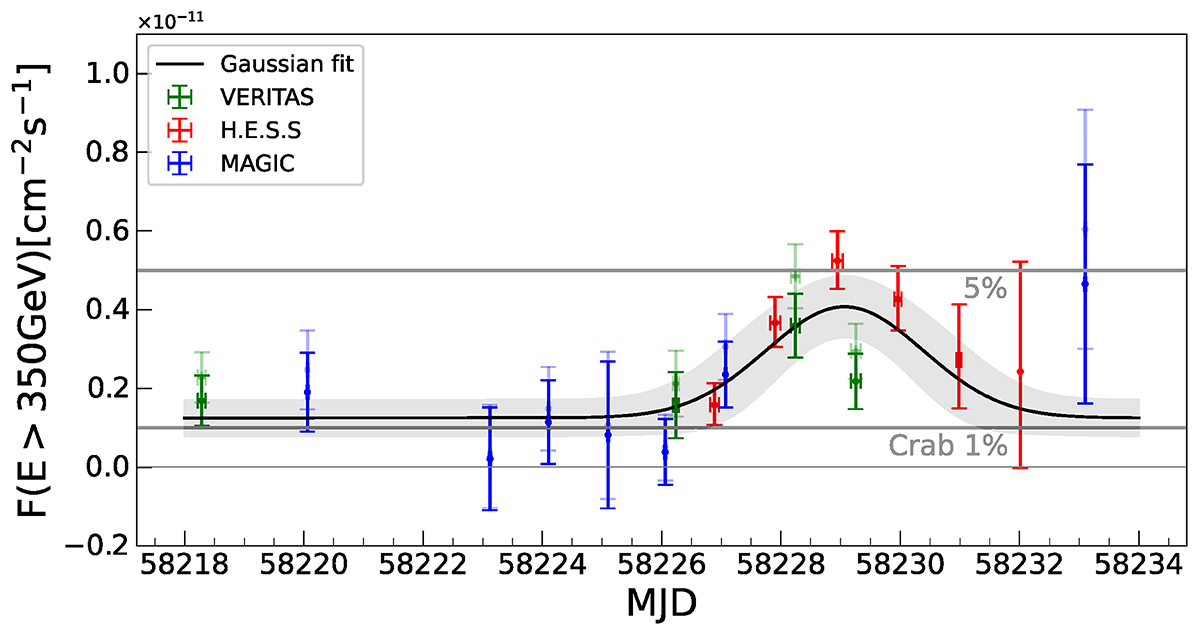
Flux measurements of M87 above 350 GeV with 1σ uncertainties obtained with H.E.S.S., MAGIC, and VERITAS during the coordinated MWL campaign in 2018. The solid and semi-transparent colours represent the original data and scaled (with cross-normalisation factors) data, respectively. The black curve and shaded region represent the best Gaussian fit and 1σ error to the original flux points. The grey lines indicate the percentage of the Crab Nebula’s flux level from integrating its SED in the same energy range. The SED of the Crab Nebula is obtained by fitting VERITAS’s six years of observations (Meagher & VERITAS Collaboration 2015). For flux points with significance less than 2σ, upper limits are given in Table C.14.
Current usage metrics show cumulative count of Article Views (full-text article views including HTML views, PDF and ePub downloads, according to the available data) and Abstracts Views on Vision4Press platform.
Data correspond to usage on the plateform after 2015. The current usage metrics is available 48-96 hours after online publication and is updated daily on week days.
Initial download of the metrics may take a while.