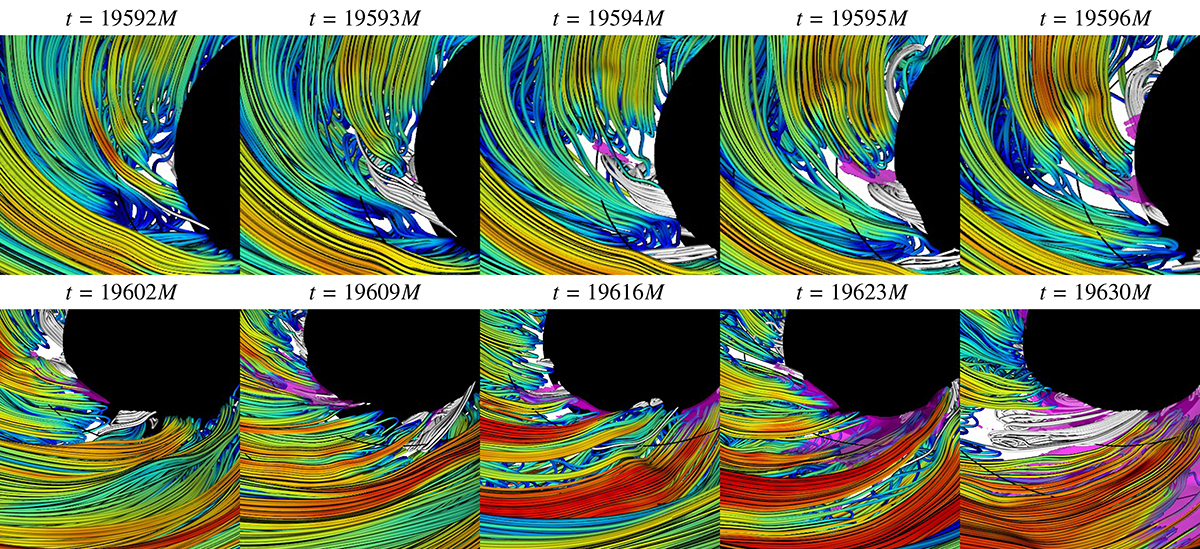
Fig. 9.
Download original image
Time evolution of magnetic field lines during onset of magnetic-flux eruption in prograde a = 0.9 case. Horizon-disconnected lines are colored by the magnetization parameter σ = b2/w, and doubly connected lines are shown in white. The magenta patches mark the relativistic temperature (log10T ≥ 0.5). All images are seen from the latitude of θobs = 45° and the azimuth of ϕobs = 180°. Black spheres indicate the outer horizon at rH = 1.436M, and black arcs seen in most panels mark the radius r = 2M in the equatorial plane θ = 90°. The upper sequence covers the time period of t = 19 592M − 19 596M every Δt = 1M (the middle frame corresponds to Fig. 6). The lower sequence covers the time period of t = 19 602M − 19 630M every Δt = 7M (the last frame corresponds to Fig. 8). An associated movie is available online.
Current usage metrics show cumulative count of Article Views (full-text article views including HTML views, PDF and ePub downloads, according to the available data) and Abstracts Views on Vision4Press platform.
Data correspond to usage on the plateform after 2015. The current usage metrics is available 48-96 hours after online publication and is updated daily on week days.
Initial download of the metrics may take a while.