Fig. 6.
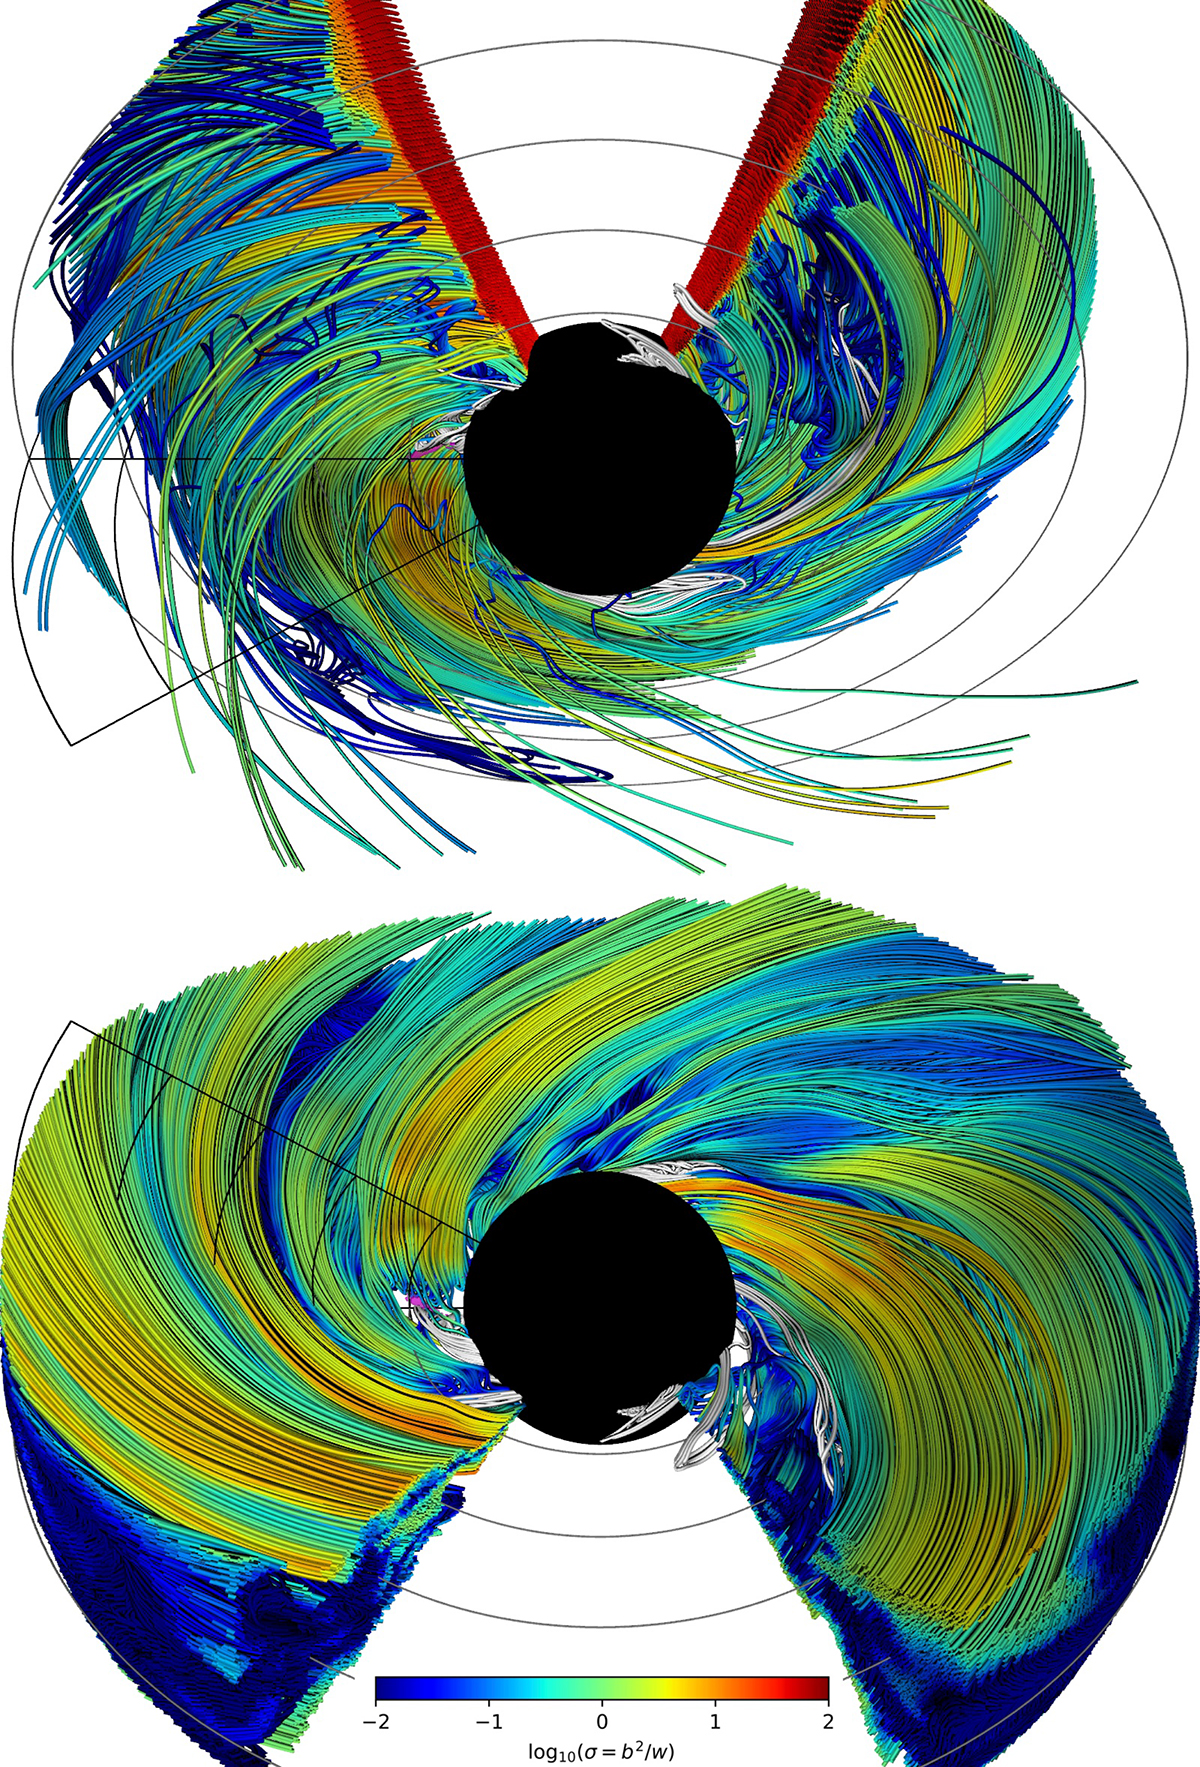
Download original image
Selected magnetic field lines within r ≤ 6M in prograde a = 0.9 case at onset of magnetic flux eruption (t = 19 594M), colored by the magnetization parameter σ = b2/w (line colors are also affected by shading, with lines seen at small angles rendered darker). Upper panel: Horizon-connected lines seeded at r0 = 5.9M for θL3, min < θ0 < 90°, seen from latitude θobs = 135°; lower panel: horizon-disconnected lines seeded at r0 = 5.9M for θL3, min < θ0 < θL3, max, seen from latitude θobs = 45°. In both panels, a small but (θ0, ϕ0)-complete sample of doubly connected lines (closed loops with max(r) < 6M) seeded at r0 = 1.42M (just under the horizon) are shown colored in white. Both images are seen from the same azimuth ϕobs = 180°; data for 150° < ϕ < 210° (except for the doubly connected lines) are cut out to reveal (r, θ) sections. Black spheres indicate the outer horizon at rH = 1.436M. The grid of arcs marks the radii r/M = 2, 3, 4, 5, 6 in the equatorial plane θ = 90° (gray) and in the ϕ = 90° quadrant spanning the latitudes θL3, min ≤ θ ≤ θL3, max (black). A small magenta patch just to the left of the horizon marks relativistic temperature (log10T ≥ 0.5). An associated movie is available online.
Current usage metrics show cumulative count of Article Views (full-text article views including HTML views, PDF and ePub downloads, according to the available data) and Abstracts Views on Vision4Press platform.
Data correspond to usage on the plateform after 2015. The current usage metrics is available 48-96 hours after online publication and is updated daily on week days.
Initial download of the metrics may take a while.