Fig. 5.
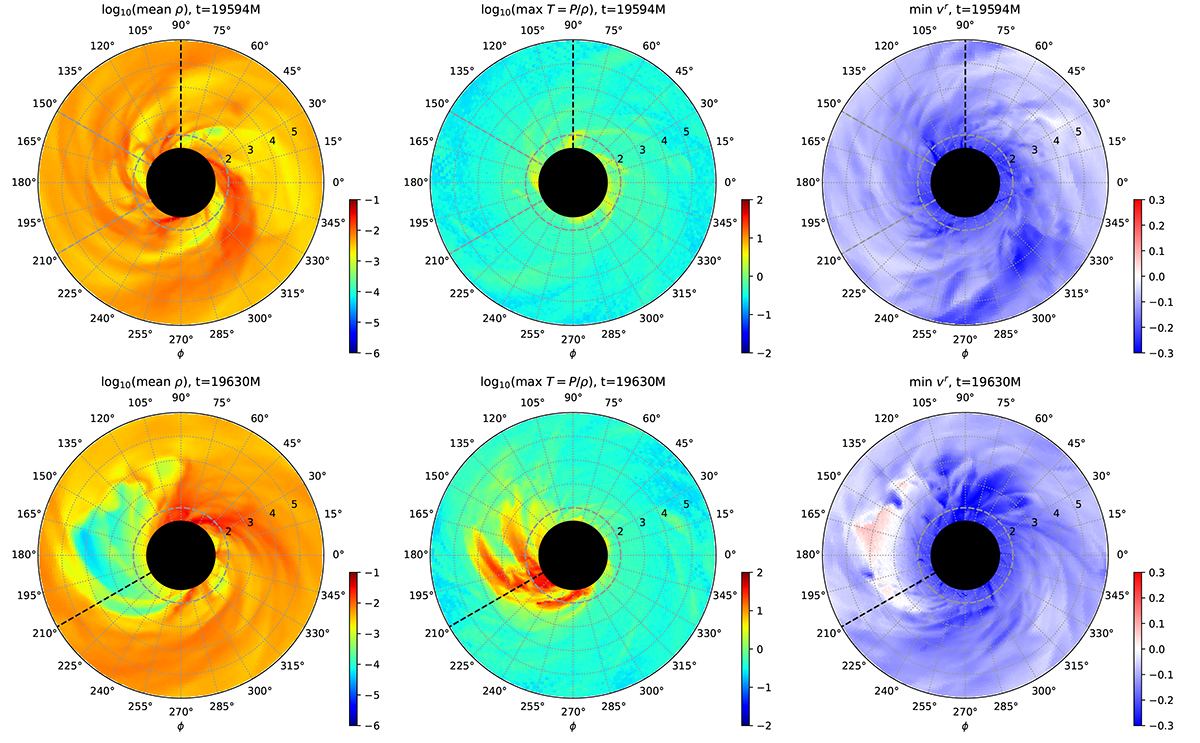
Download original image
Maps in (r, ϕ) coordinates of parameter statistics drawn from latitudinal arcs θL3, min < θ < θL3, max for the a = 0.9 case at two epochs: t = 19 594M (upper row of panels) and t = 19 630M (lower row of panels). From the left, the panels show (1) mean density ρmean in log scale, (2) maximum temperature Tmax in log scale, and (3) minimum radial velocity vminr. The black circles mark the BH with horizon radius rH ≃ 1.436M, the gray dashed circles mark the θ = 90° ergosphere boundary rE = 2M, the gray dashed lines in the upper panels mark the cutout ϕ sector in Figs. 6 and 7, and the black dashed lines mark the ϕ values for the (r, θ) maps presented in Fig. 4.
Current usage metrics show cumulative count of Article Views (full-text article views including HTML views, PDF and ePub downloads, according to the available data) and Abstracts Views on Vision4Press platform.
Data correspond to usage on the plateform after 2015. The current usage metrics is available 48-96 hours after online publication and is updated daily on week days.
Initial download of the metrics may take a while.