Fig. 11.
Download original image
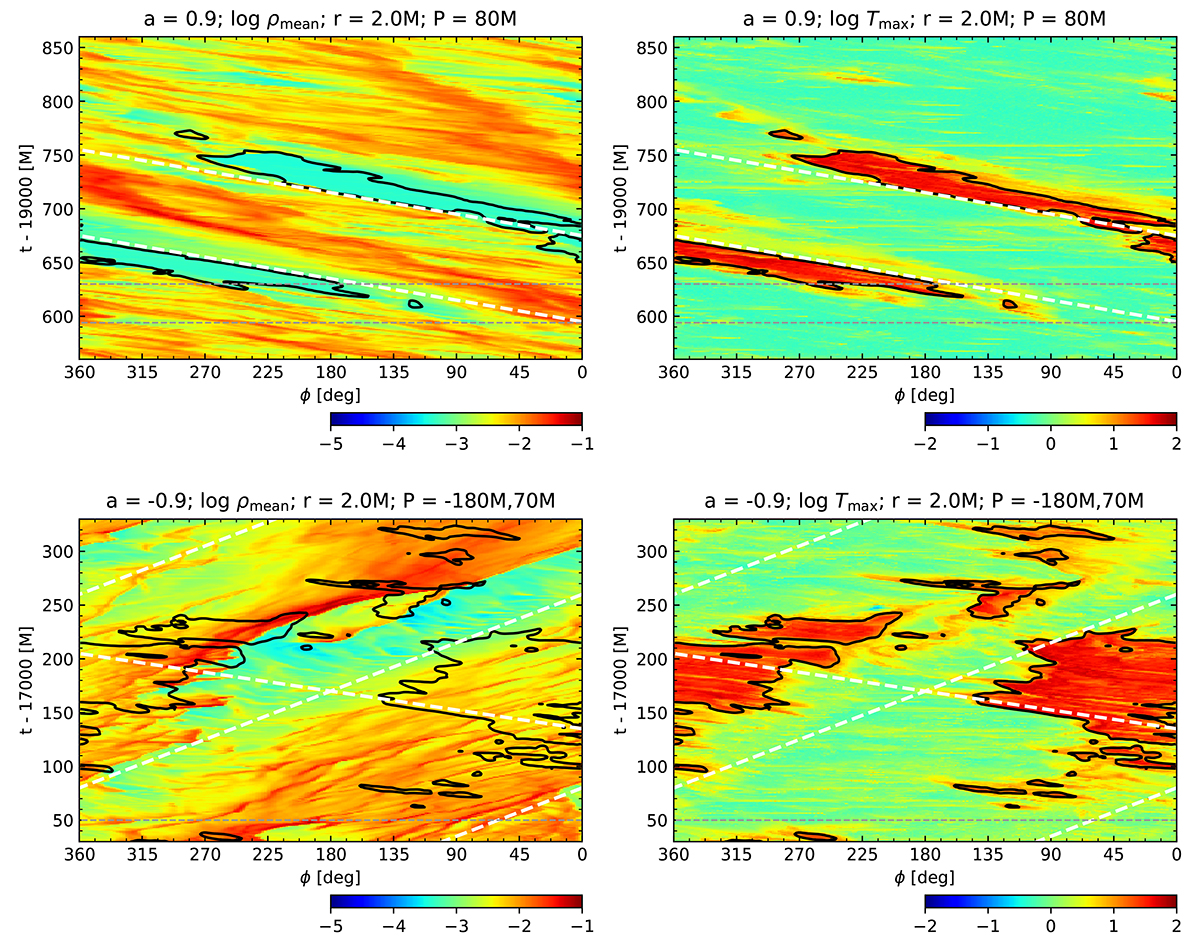
Spacetime diagrams in (t, ϕ) coordinates for parameters presented in Fig. 5; mean plasma density ρmean (left panels) and maximum plasma temperature Tmax (right panels), with statistics taken over θL3, min < θ < θL3, max at fixed radius r = 2M. The black contours indicate log10Tmax = 1. The white dashed lines mark linear rotation trends. The upper panels present the prograde a = 0.9 case in the time window 19 500M < t < 19 900M (trend with rotation period 85M); the lower panels present the retrograde a = −0.9 case in the time window 16 900M < t < 17 400M (trends with rotation periods −180M, 70M).
Current usage metrics show cumulative count of Article Views (full-text article views including HTML views, PDF and ePub downloads, according to the available data) and Abstracts Views on Vision4Press platform.
Data correspond to usage on the plateform after 2015. The current usage metrics is available 48-96 hours after online publication and is updated daily on week days.
Initial download of the metrics may take a while.