Fig. 9
Download original image
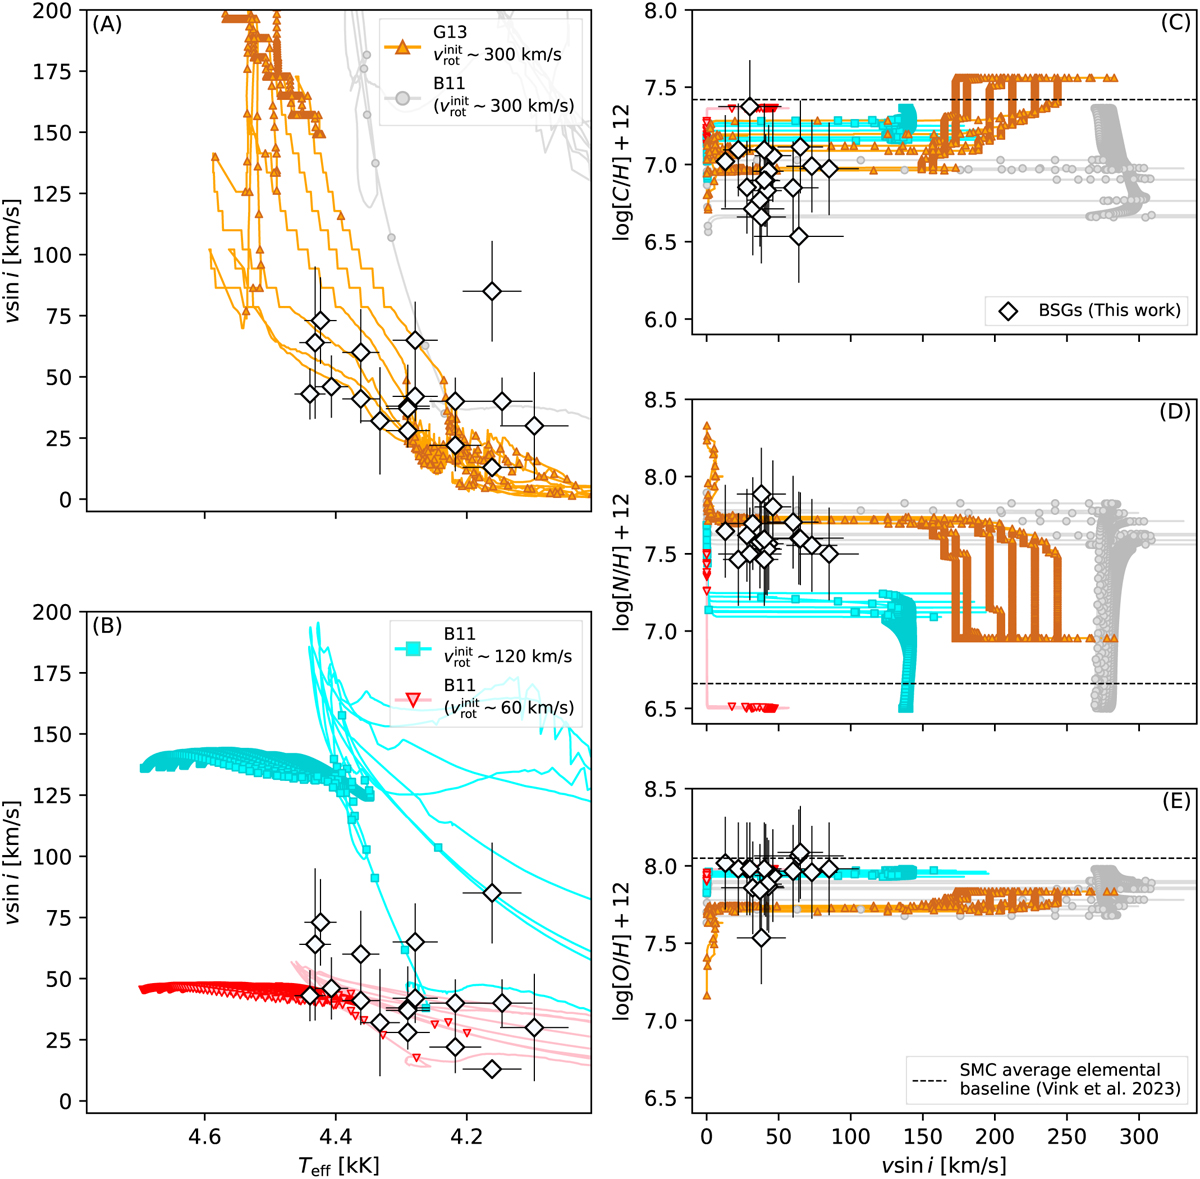
Comparison of effective temperature, rotation, and CNO enrichment–depletion between G13 (orange tracks with triangle symbols, Georgy et al. 2013), B11 (gray, blue, and pink tracks, Brott et al. 2011), and our spectroscopic determinations (white diamonds). In this figure, we include tracks with initial masses from 12 to 50 M⊙ (to 40 M⊙ for the G13 set). The tracks’ equatorial rotation velocities are scaled by π/4 to account for the stars’ inclinations (e.g., Hunter et al. 2009). As in Fig. 7, the points along the tracks mark intervals of about 50 kyr. Baseline CNO values of B11 models are respectively 7.37, 6.50, and 7.98, while for G13 those are 7.56, 6.95, and 7.83. The dashed horizontal lines mark the CNO average baselines listed in Vink et al. (2023, Table 2) determined as the average values from previous studies. Panel A and B show the evolution of the rotation against Teff while panels C, D, and E show respectively the evolution of the surface C, N, and O vs. the rotation.
Current usage metrics show cumulative count of Article Views (full-text article views including HTML views, PDF and ePub downloads, according to the available data) and Abstracts Views on Vision4Press platform.
Data correspond to usage on the plateform after 2015. The current usage metrics is available 48-96 hours after online publication and is updated daily on week days.
Initial download of the metrics may take a while.