Fig. 5
Download original image
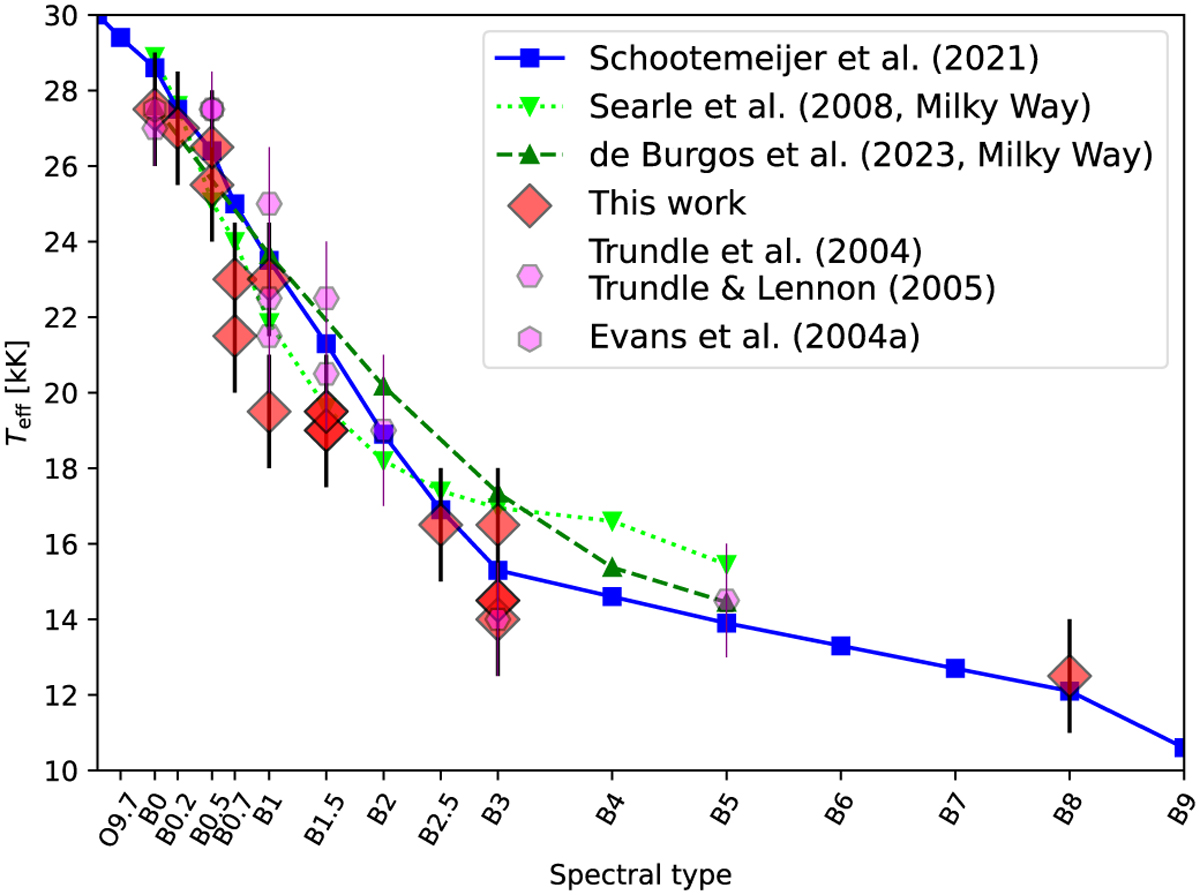
Comparison between effective temperatures and spectral types. The red diamond symbols represent our spectroscopic determinations, whereas the hexagons are literature values from Evans et al. (2004a), Trundle et al. (2004), and Trundle & Lennon (2005). The plotted curves are the calibrations from Schootemeijer et al. (2021) for the SMC stars (solid blue curve), Searle et al. (2008, dotted green curve), and de Burgos et al. (2023, dashed dark green curve) for Galactic BSGs.
Current usage metrics show cumulative count of Article Views (full-text article views including HTML views, PDF and ePub downloads, according to the available data) and Abstracts Views on Vision4Press platform.
Data correspond to usage on the plateform after 2015. The current usage metrics is available 48-96 hours after online publication and is updated daily on week days.
Initial download of the metrics may take a while.