Fig. E.2
Download original image
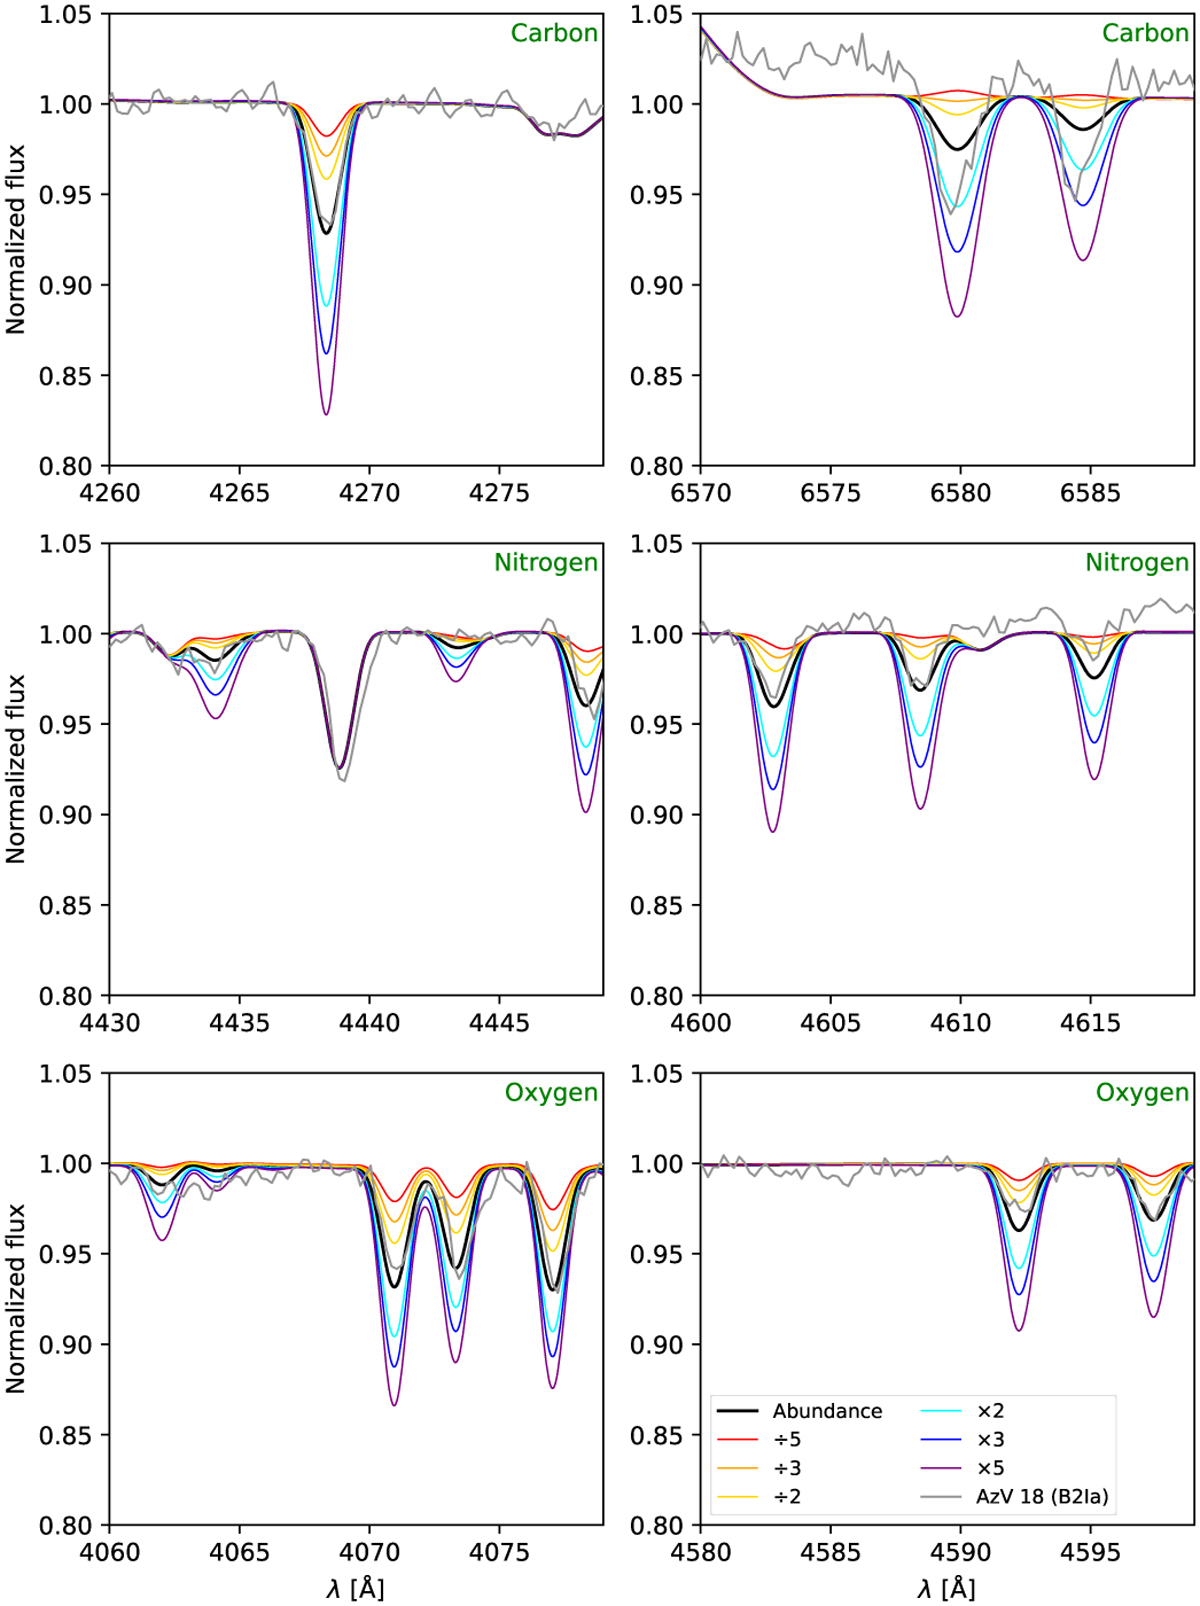
Illustration of the determination of the CNO abundance determination for AzV 18. The observed spectrum is the gray line. The thick black line is the model we found to have the best compromise between the diagnostic lines for each element. Each thin line represents the best-fit abundances for the respective element multiplied or divided by factors of 2, 3, and 5. This also guided us to adopt an uncertainty of 0.3 dex.
Current usage metrics show cumulative count of Article Views (full-text article views including HTML views, PDF and ePub downloads, according to the available data) and Abstracts Views on Vision4Press platform.
Data correspond to usage on the plateform after 2015. The current usage metrics is available 48-96 hours after online publication and is updated daily on week days.
Initial download of the metrics may take a while.