Fig. 21
Download original image
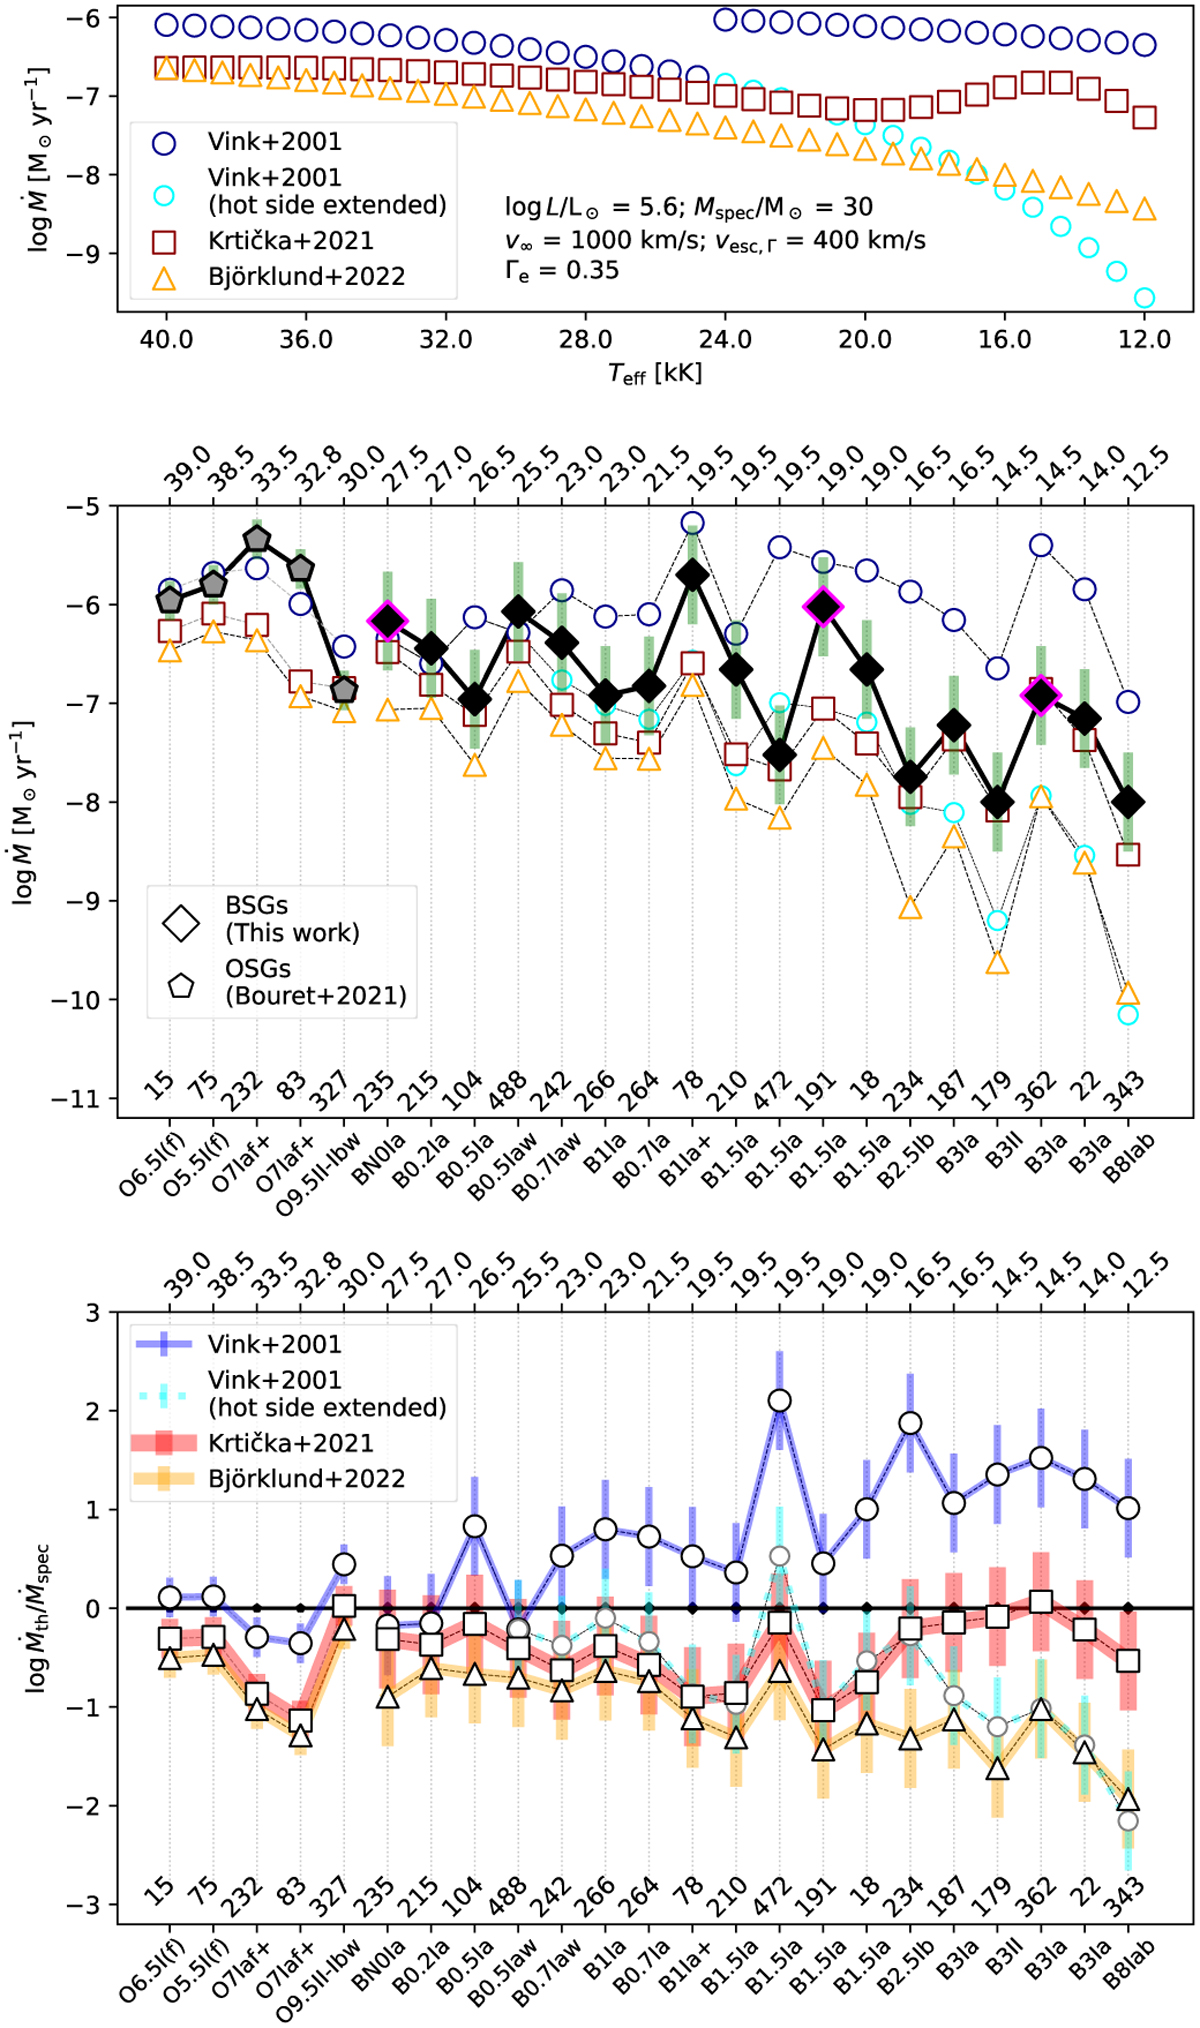
Upper panel: different mass-loss prescriptions applied to a generic star with the same properties but varying Teff for illustrative purposes, to facilitate the visualization of the predicted ![]() (Teff) behaviors. Vink et al. (2001) rates are represented by white circles, Krtička et al. (2024) by white squares, and Björklund et al. (2023) by white triangles. Middle panel: comparison between different mass-loss rate prescriptions and inferred values for the sample stars (black diamonds) and OSGs from Bouret et al. (2021, gray pentagons). The fuchsia-outlined diamonds are the targets where we did not find a satisfactory fitting of Balmer lines. The applied theoretical values have the same symbols as the upper panel. The stars are ordered according to their Teff in the upper axis. The lower axes show the spectral types of each star. Lower panel: similar to the previous panel, but showing the ratio of the predicted according to each recipe (
(Teff) behaviors. Vink et al. (2001) rates are represented by white circles, Krtička et al. (2024) by white squares, and Björklund et al. (2023) by white triangles. Middle panel: comparison between different mass-loss rate prescriptions and inferred values for the sample stars (black diamonds) and OSGs from Bouret et al. (2021, gray pentagons). The fuchsia-outlined diamonds are the targets where we did not find a satisfactory fitting of Balmer lines. The applied theoretical values have the same symbols as the upper panel. The stars are ordered according to their Teff in the upper axis. The lower axes show the spectral types of each star. Lower panel: similar to the previous panel, but showing the ratio of the predicted according to each recipe (![]() th) to our empirical determinations. The symbols follow the same encoding from the previous panels.
th) to our empirical determinations. The symbols follow the same encoding from the previous panels.
Current usage metrics show cumulative count of Article Views (full-text article views including HTML views, PDF and ePub downloads, according to the available data) and Abstracts Views on Vision4Press platform.
Data correspond to usage on the plateform after 2015. The current usage metrics is available 48-96 hours after online publication and is updated daily on week days.
Initial download of the metrics may take a while.