Fig. 19
Download original image
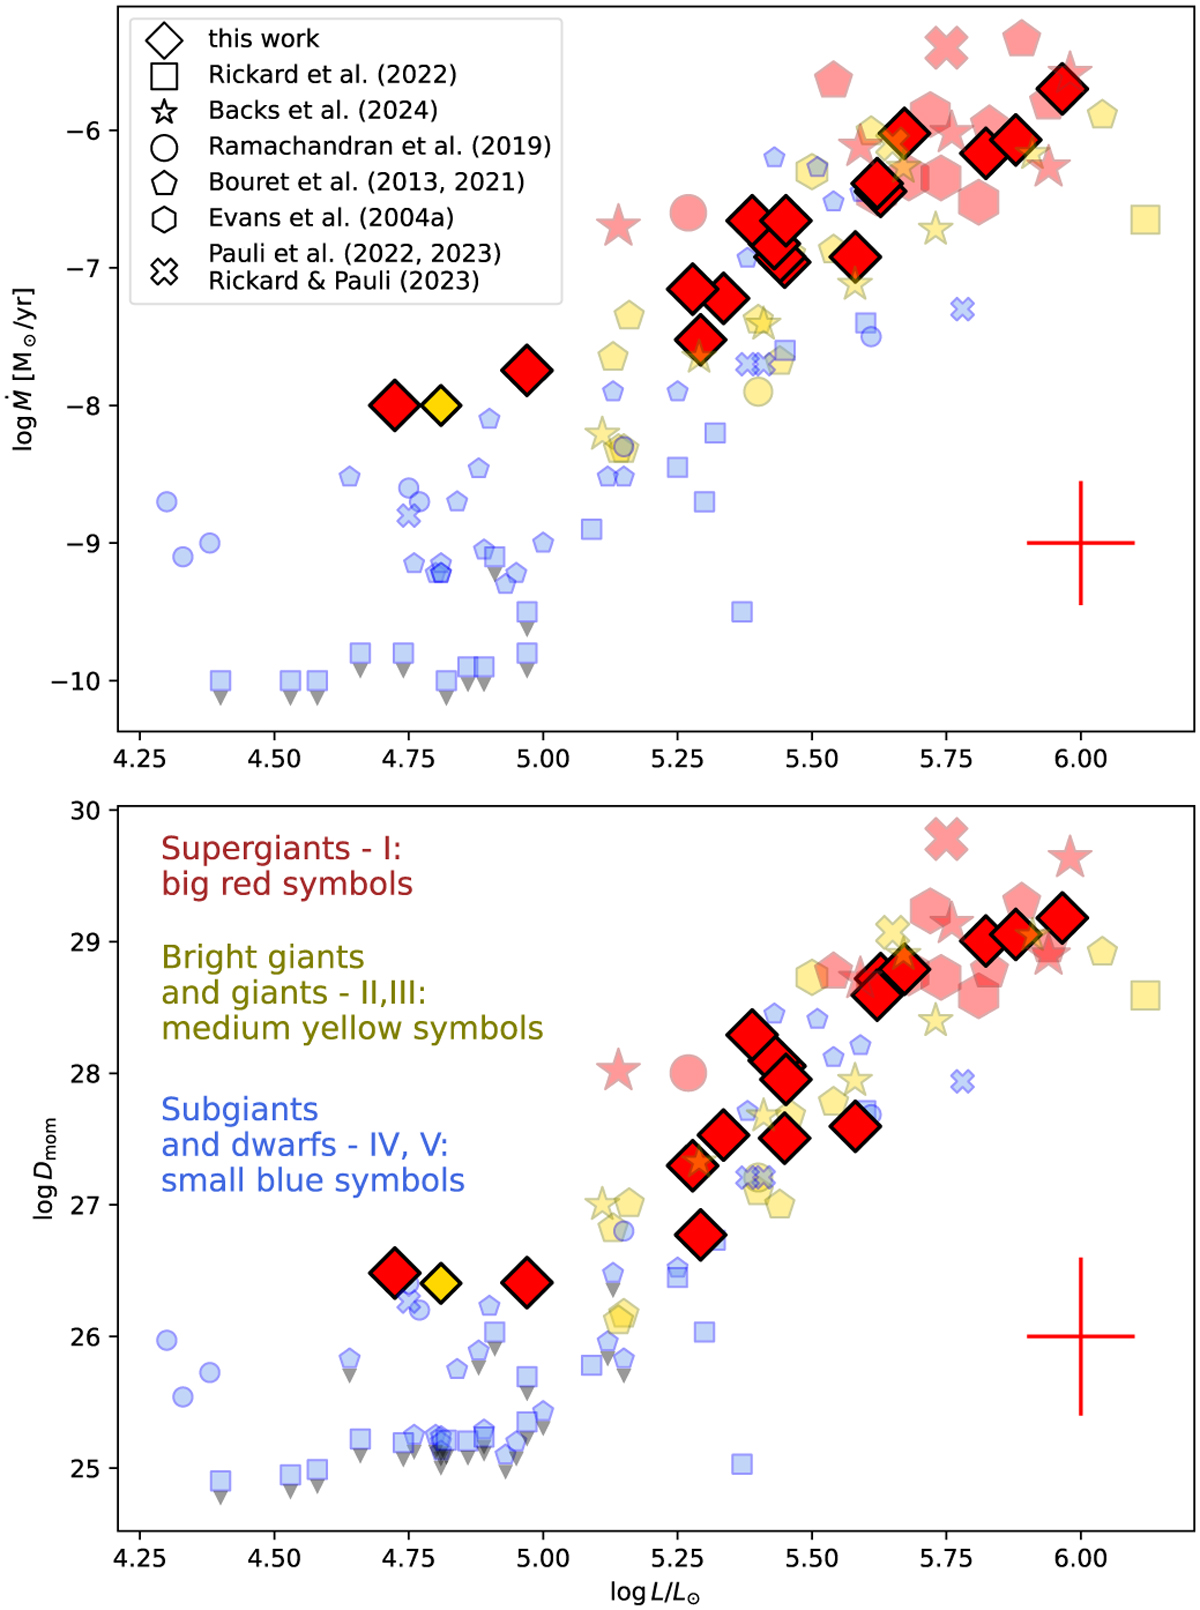
Mass-loss vs. luminosity (upper panel) and modified wind-momentum vs. luminosity (lower panel) diagrams of SMC OB stars of different sources and luminosity classes. The different symbols mark different studies and different colors/sizes mark different luminosity classes. Error bars are not shown for visual clarity. The literature values are slightly translucent whereas the diamonds represent our sample BSGs. The error bars in the lower right corner indicate the typical associated errors for our sample. The scatter points with downward black triangles denote upper limits.
Current usage metrics show cumulative count of Article Views (full-text article views including HTML views, PDF and ePub downloads, according to the available data) and Abstracts Views on Vision4Press platform.
Data correspond to usage on the plateform after 2015. The current usage metrics is available 48-96 hours after online publication and is updated daily on week days.
Initial download of the metrics may take a while.