Fig. 16
Download original image
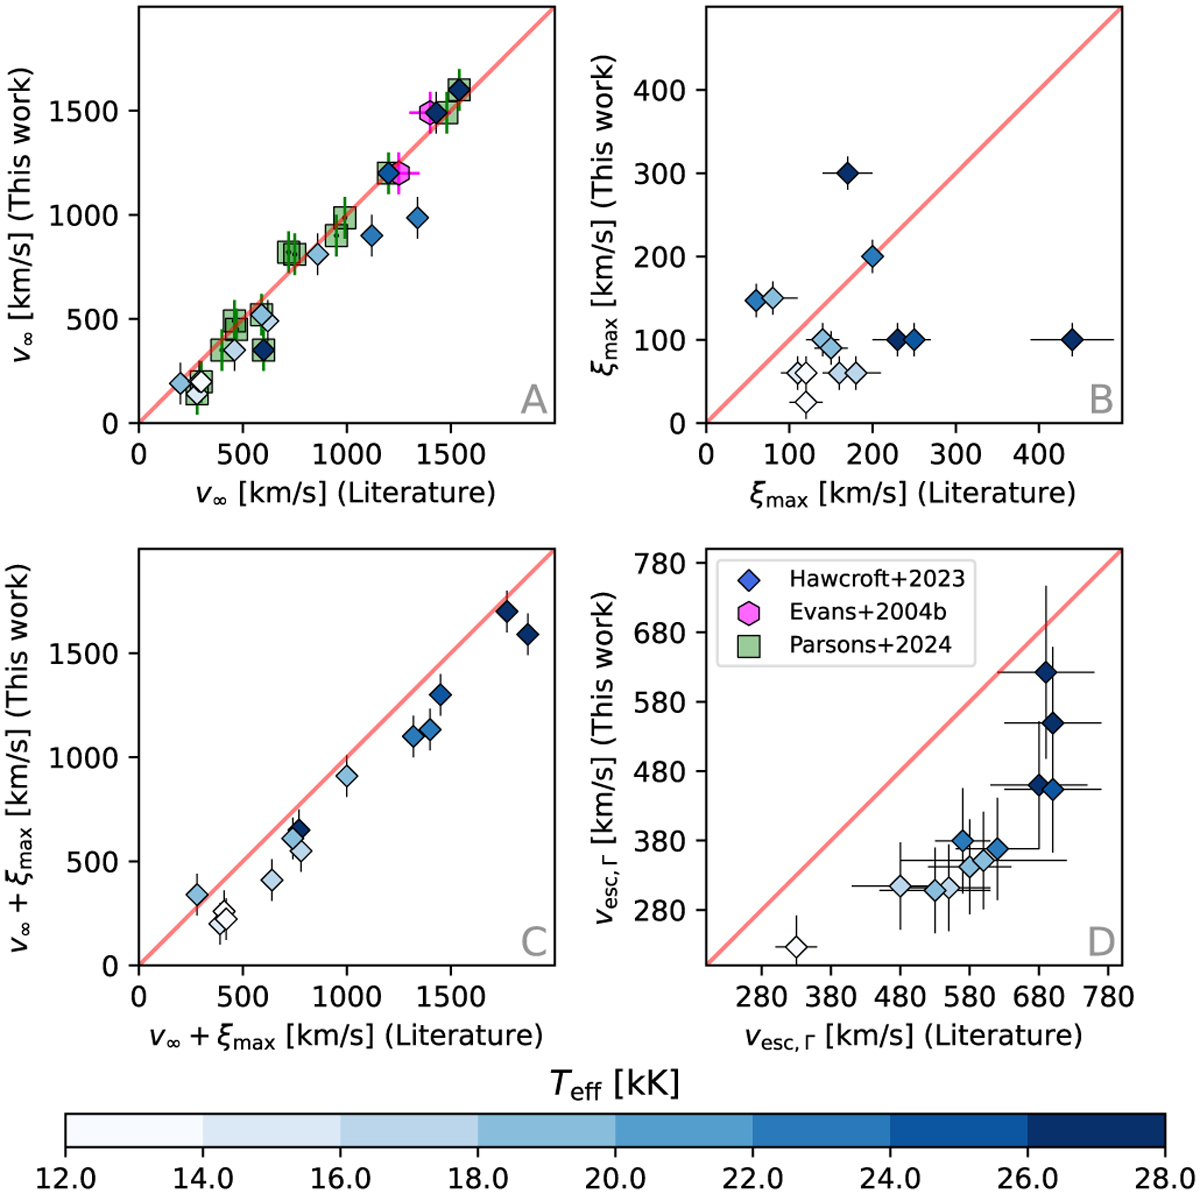
Panel A: Comparison between derived terminal velocities (v∞) by this study and those from Hawcroft et al. (2024, small blue diamonds) and Parsons et al. (2024, green squares). The fuchsia hexagons are data from Evans et al. (2004a), which also obtained wind properties via optical and UV analysis with CMFGEN. Panel B: Comparison of the wind microturbulent velocities (ξmax) between this work and Hawcroft et al. (2024). Panel C: Comparison between the sum of v∞ and ξmax, which would roughly translate the width of the absorption component of the UV P Cygni profiles. Panel D: Comparison of the Γ-corrected escape velocities (vesc,Γ) between this study and Hawcroft et al. (2024).
Current usage metrics show cumulative count of Article Views (full-text article views including HTML views, PDF and ePub downloads, according to the available data) and Abstracts Views on Vision4Press platform.
Data correspond to usage on the plateform after 2015. The current usage metrics is available 48-96 hours after online publication and is updated daily on week days.
Initial download of the metrics may take a while.