Fig. 15
Download original image
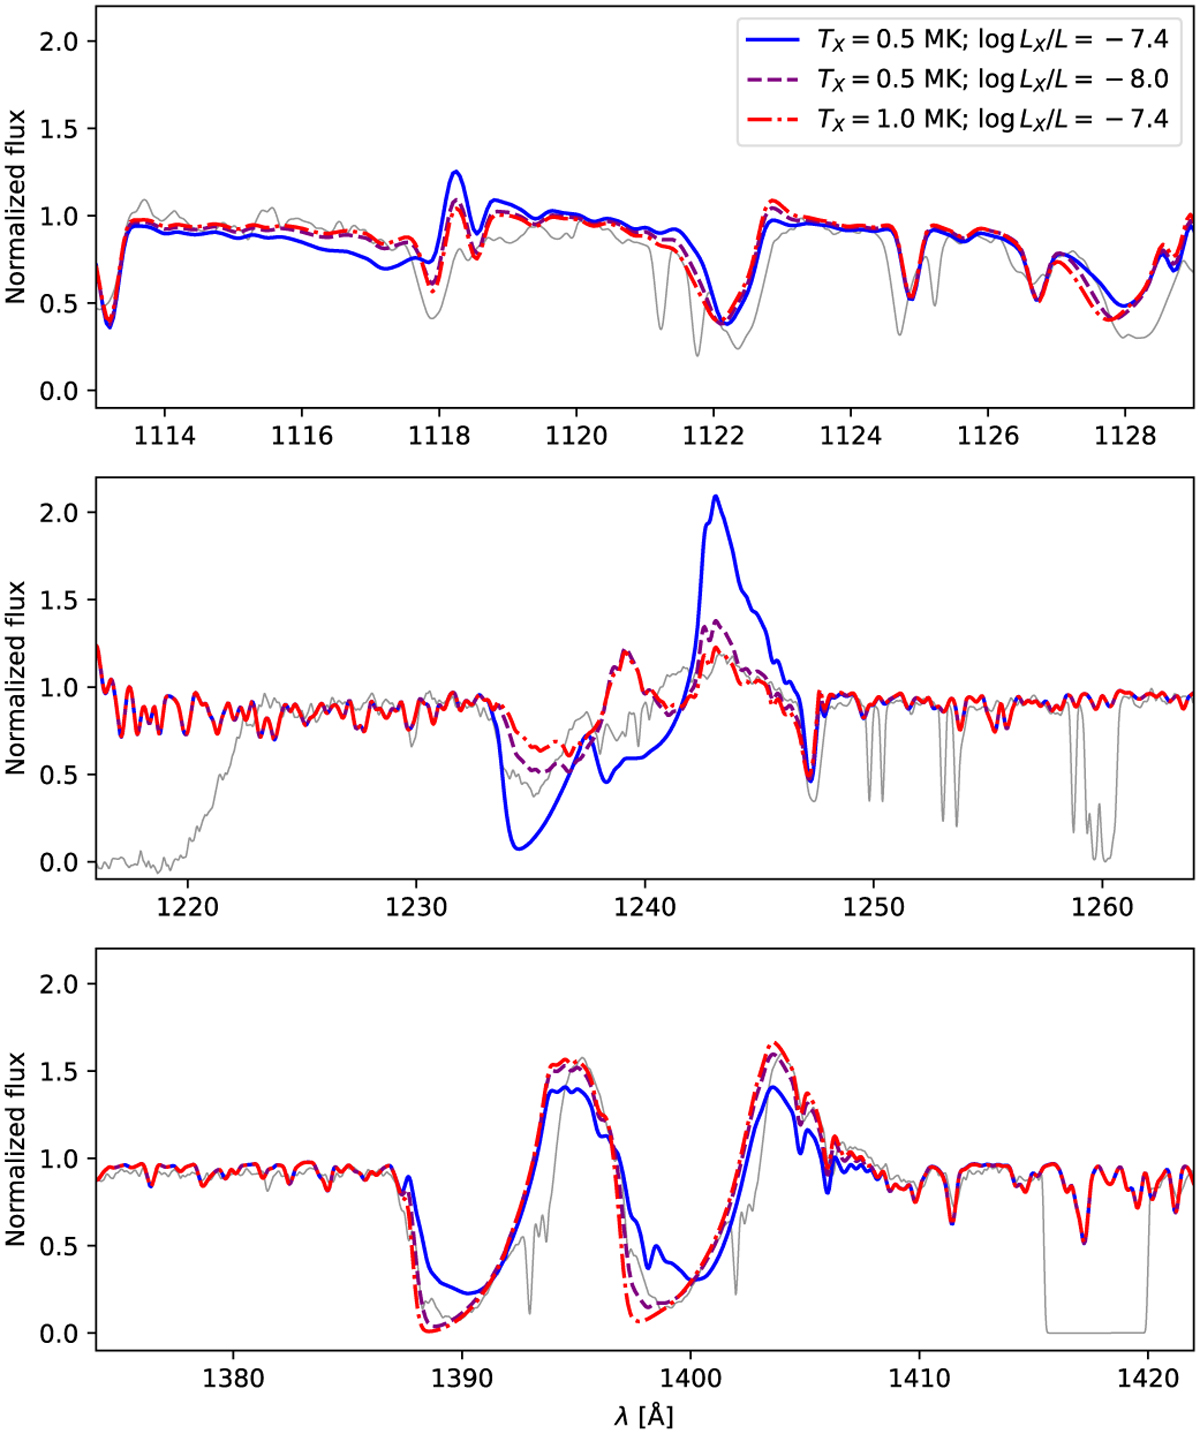
Comparison between models with different relative X-ray luminosity and shock temperature parameters. The thin gray line is the normalized UV spectrum and the colored lines are the CMFGEN models. The blue filled line is the model with TX = 0.5 MK and log(LX/L) = −7.4. The purple dashed line has the same temperature, but with a lower log(LX/L) = −8.0. The red dot-dashed line has the same log(LX/L) = −7.4, but a higher TX = 1.0 MK. The different LX are obtained by varying the X-ray emission filling factor. All the additional X-ray parameters are kept the same for all the models.
Current usage metrics show cumulative count of Article Views (full-text article views including HTML views, PDF and ePub downloads, according to the available data) and Abstracts Views on Vision4Press platform.
Data correspond to usage on the plateform after 2015. The current usage metrics is available 48-96 hours after online publication and is updated daily on week days.
Initial download of the metrics may take a while.