Fig. 11
Download original image
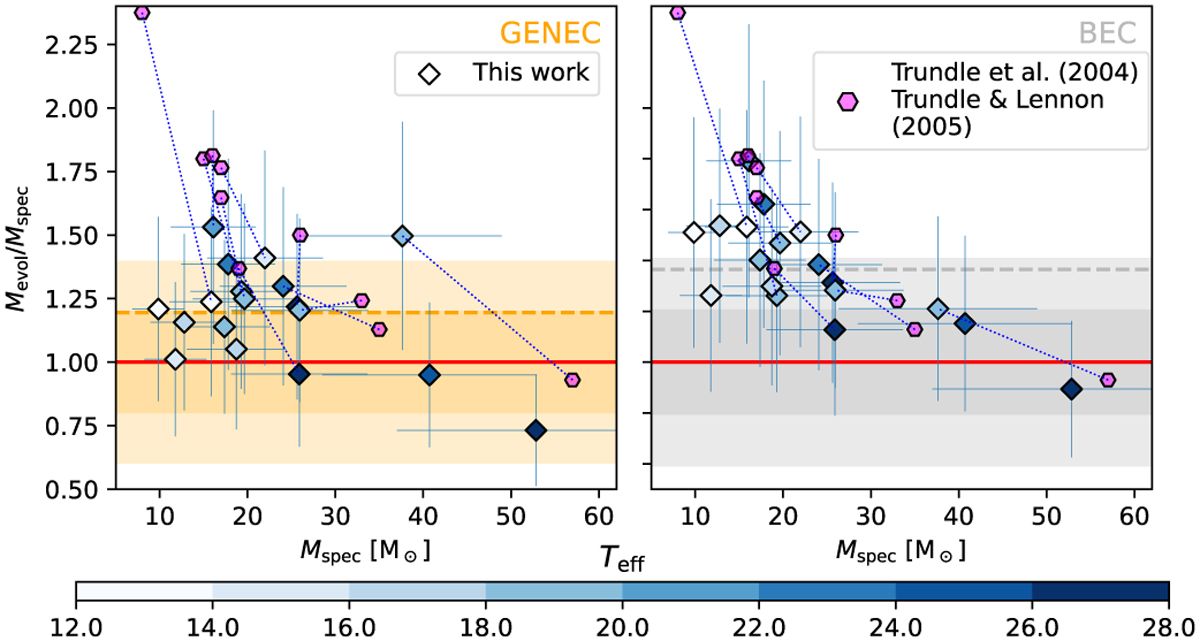
Comparison between evolutionary and spectroscopic masses. The color bar represents the effective temperature of the targets with lighter colors reflecting lower Teff. The fuchsia hexagons correspond to the data of Trundle et al. (2004) and Trundle & Lennon (2005) and the dotted blue lines connect the same stars. The darker horizontal orange and gray bands represent, respectively, the intervals of 1σ obtained for G13 and B11. Likewise, the lighter colored bands are for 2σ.
Current usage metrics show cumulative count of Article Views (full-text article views including HTML views, PDF and ePub downloads, according to the available data) and Abstracts Views on Vision4Press platform.
Data correspond to usage on the plateform after 2015. The current usage metrics is available 48-96 hours after online publication and is updated daily on week days.
Initial download of the metrics may take a while.