Fig. 10
Download original image
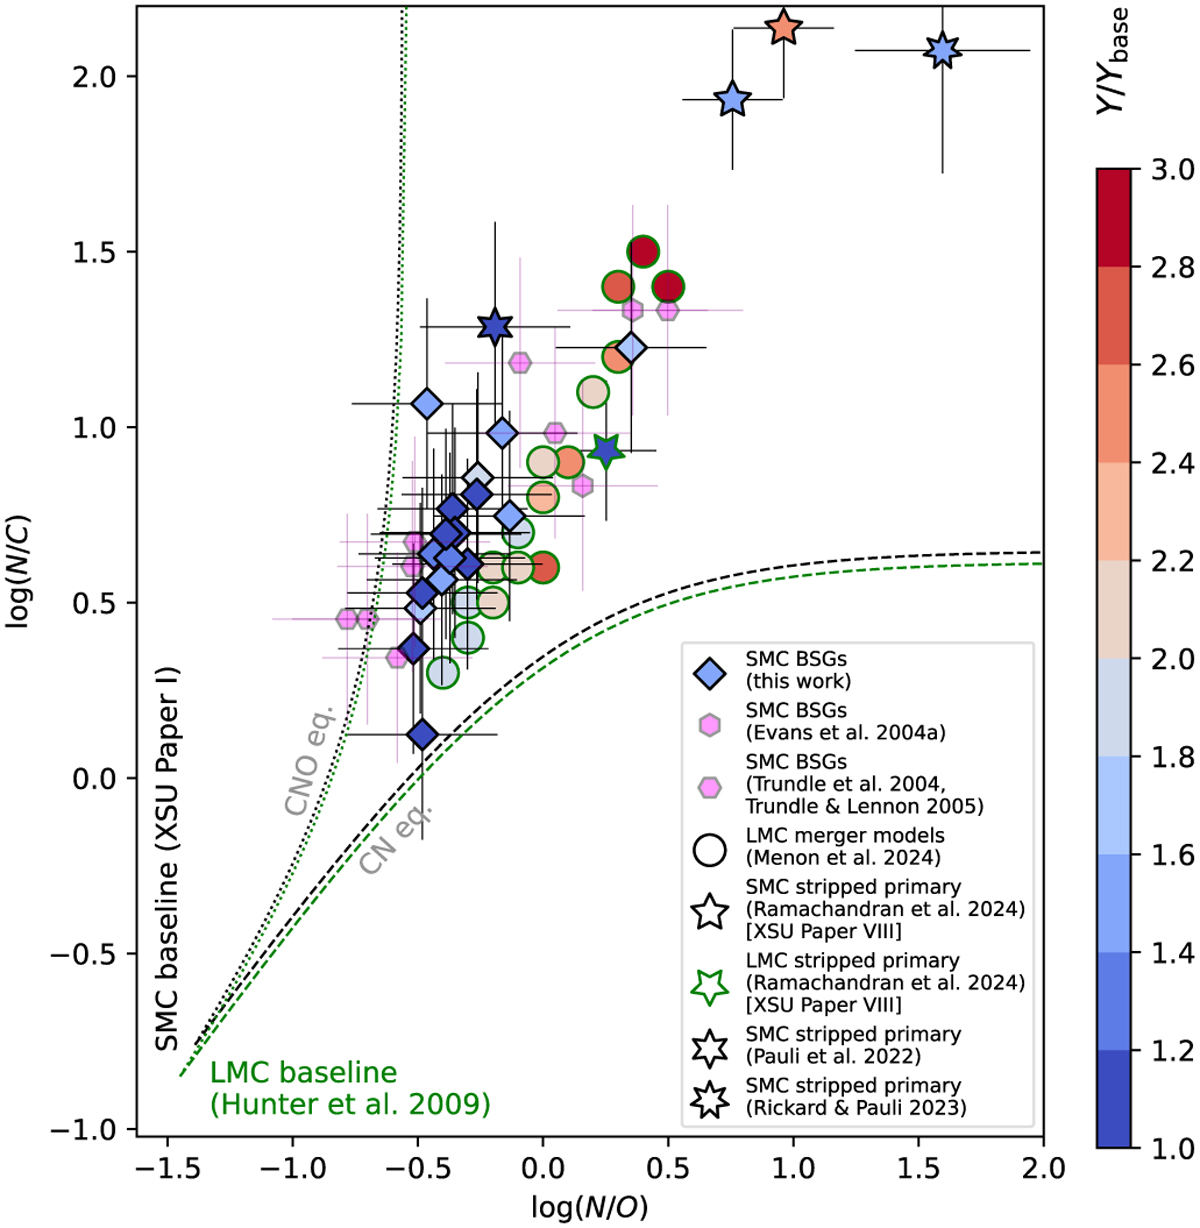
N/C vs. N/O diagram. The dashed lines show the CN and CNO equilibrium curves for the SMC (in fuchsia) and LMC (in black) using the respective baseline abundances from XShootU Paper I (Vink et al. 2023) and from Hunter et al. (2009), which was the same used by the LMC merger models of Menon et al. (2024, circles). The star symbols with green contours represent the ratios determined for SMC stripped stars from Pauli et al. (2022, six-pointed star), Rickard & Pauli (2023, seven-pointed star), and XShootU Paper VIII (Ramachandran et al. 2024, five-pointed star). The diamonds show the ratios of our sample BSGs and the fuchsia hexagons represent ratios determined by Evans et al. (2004a); Trundle et al. (2004); Trundle & Lennon (2005). Those do not provide He abundance determination, whose enrichment relative to the baseline is represented by the color scale applied to the symbols.
Current usage metrics show cumulative count of Article Views (full-text article views including HTML views, PDF and ePub downloads, according to the available data) and Abstracts Views on Vision4Press platform.
Data correspond to usage on the plateform after 2015. The current usage metrics is available 48-96 hours after online publication and is updated daily on week days.
Initial download of the metrics may take a while.