Fig. 9
Download original image
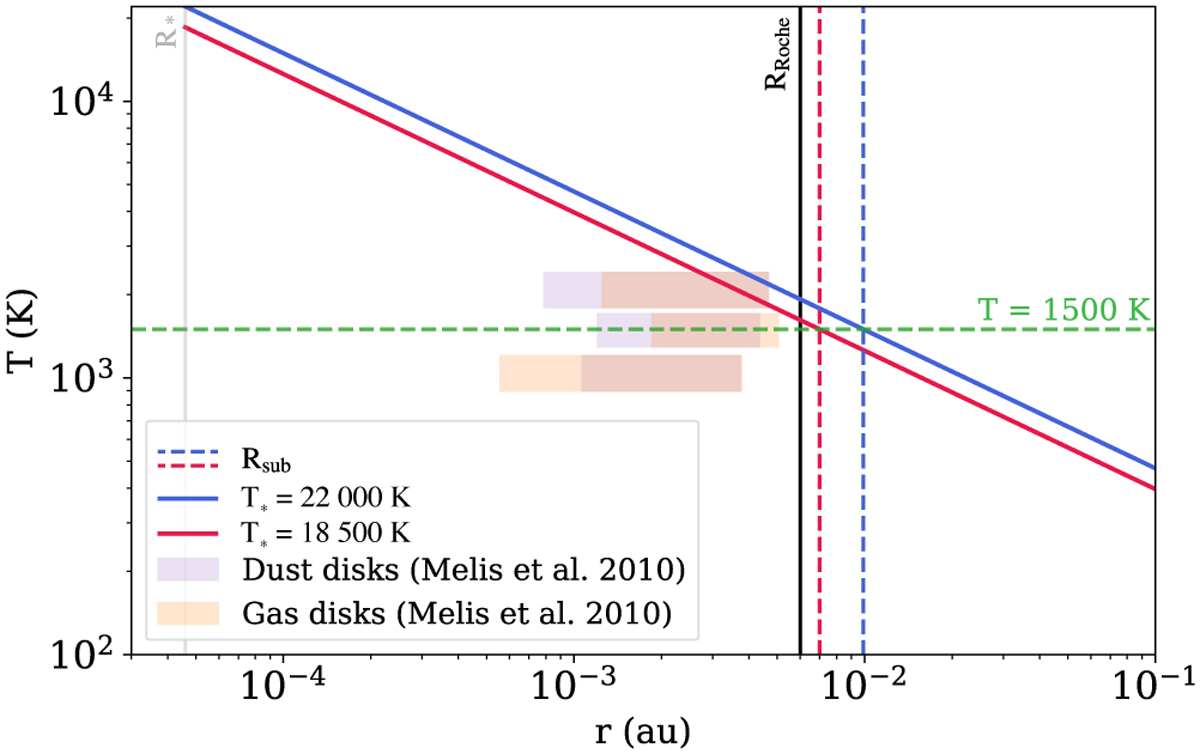
Spatial extent of three gas and dust discs that are detected by Melis et al. (2010). The dust discs are marked by grey rectangles, while the gas discs are marked by orange rectangles. To improve visibility, the discs for each system are offset vertically. For the two stellar effective temperatures used in the Melis et al. (2010) study, namely 18 500 K (red lines) and 22 000 K (blue lines), the blackbody temperature profile (light red and blue lines) is shown. A horizontal green line indicates the sublimation temperature (1500 K). The figure displays the sublimation radius for each configuration with vertical dashed lines. The dashed grey line indicates the radius of the WD, while the solid black line represents the Roche limit.
Current usage metrics show cumulative count of Article Views (full-text article views including HTML views, PDF and ePub downloads, according to the available data) and Abstracts Views on Vision4Press platform.
Data correspond to usage on the plateform after 2015. The current usage metrics is available 48-96 hours after online publication and is updated daily on week days.
Initial download of the metrics may take a while.