Fig. 6
Download original image
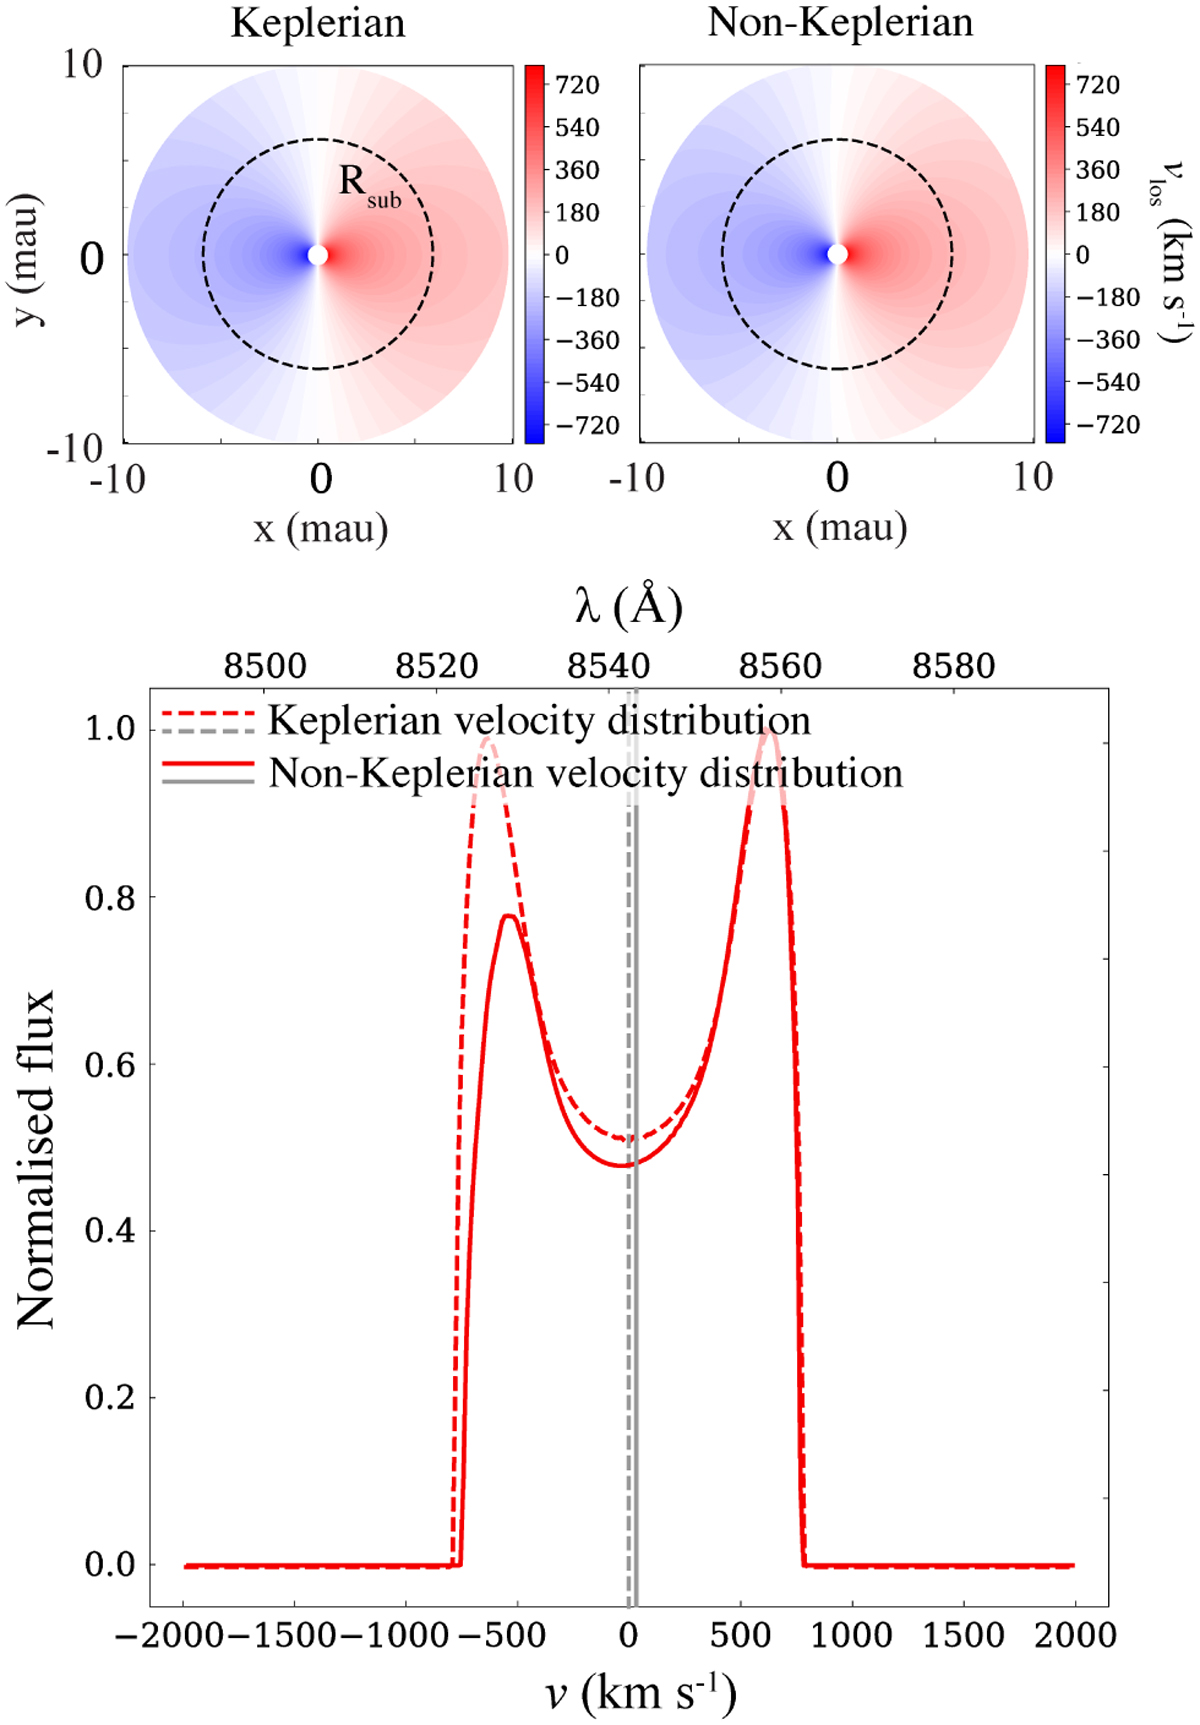
Comparison of a Keplerian disc and model B1. The upper panel displays the line-of-sight velocity distribution in a Keplerian disc as well as that of model B1 from the hydrodynamic simulations (t = 132.3 days). The sublimation radius is indicated by black dashed lines. The lower panel shows the calculated Ca II line profiles with dashed and solid lines in the two cases. The line centres are marked by vertical grey lines.
Current usage metrics show cumulative count of Article Views (full-text article views including HTML views, PDF and ePub downloads, according to the available data) and Abstracts Views on Vision4Press platform.
Data correspond to usage on the plateform after 2015. The current usage metrics is available 48-96 hours after online publication and is updated daily on week days.
Initial download of the metrics may take a while.