Fig. 5
Download original image
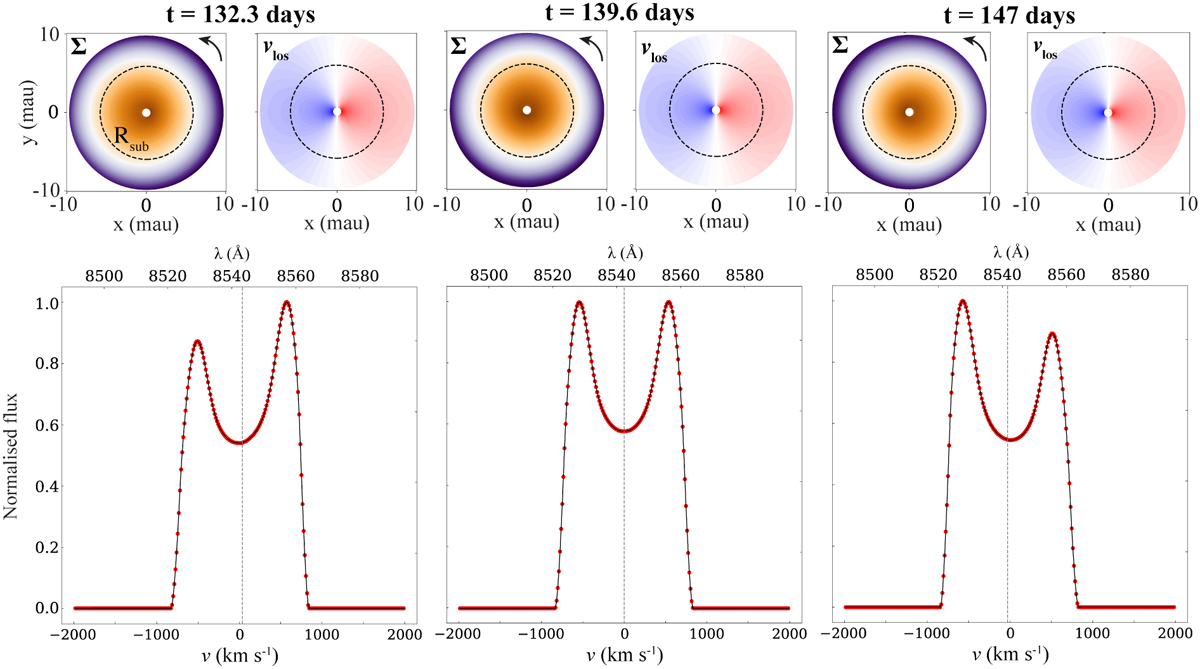
Density and velocity distributions (Σ and vlos, respectively) in model B 1 at three points in time (top row) and the corresponding background-normalised Ca II lines (bottom row). The discs are viewed from below. The sublimation radius is marked by a black dashed line, and the orbital direction of the planet is shown with a black arrow. In the Panels showing the Ca II lines, vertical dashed lines indicate the centre of the line. The retrograde precession of the disc causes a periodic shift in the intensity maximum.
Current usage metrics show cumulative count of Article Views (full-text article views including HTML views, PDF and ePub downloads, according to the available data) and Abstracts Views on Vision4Press platform.
Data correspond to usage on the plateform after 2015. The current usage metrics is available 48-96 hours after online publication and is updated daily on week days.
Initial download of the metrics may take a while.