Fig. B.1
Download original image
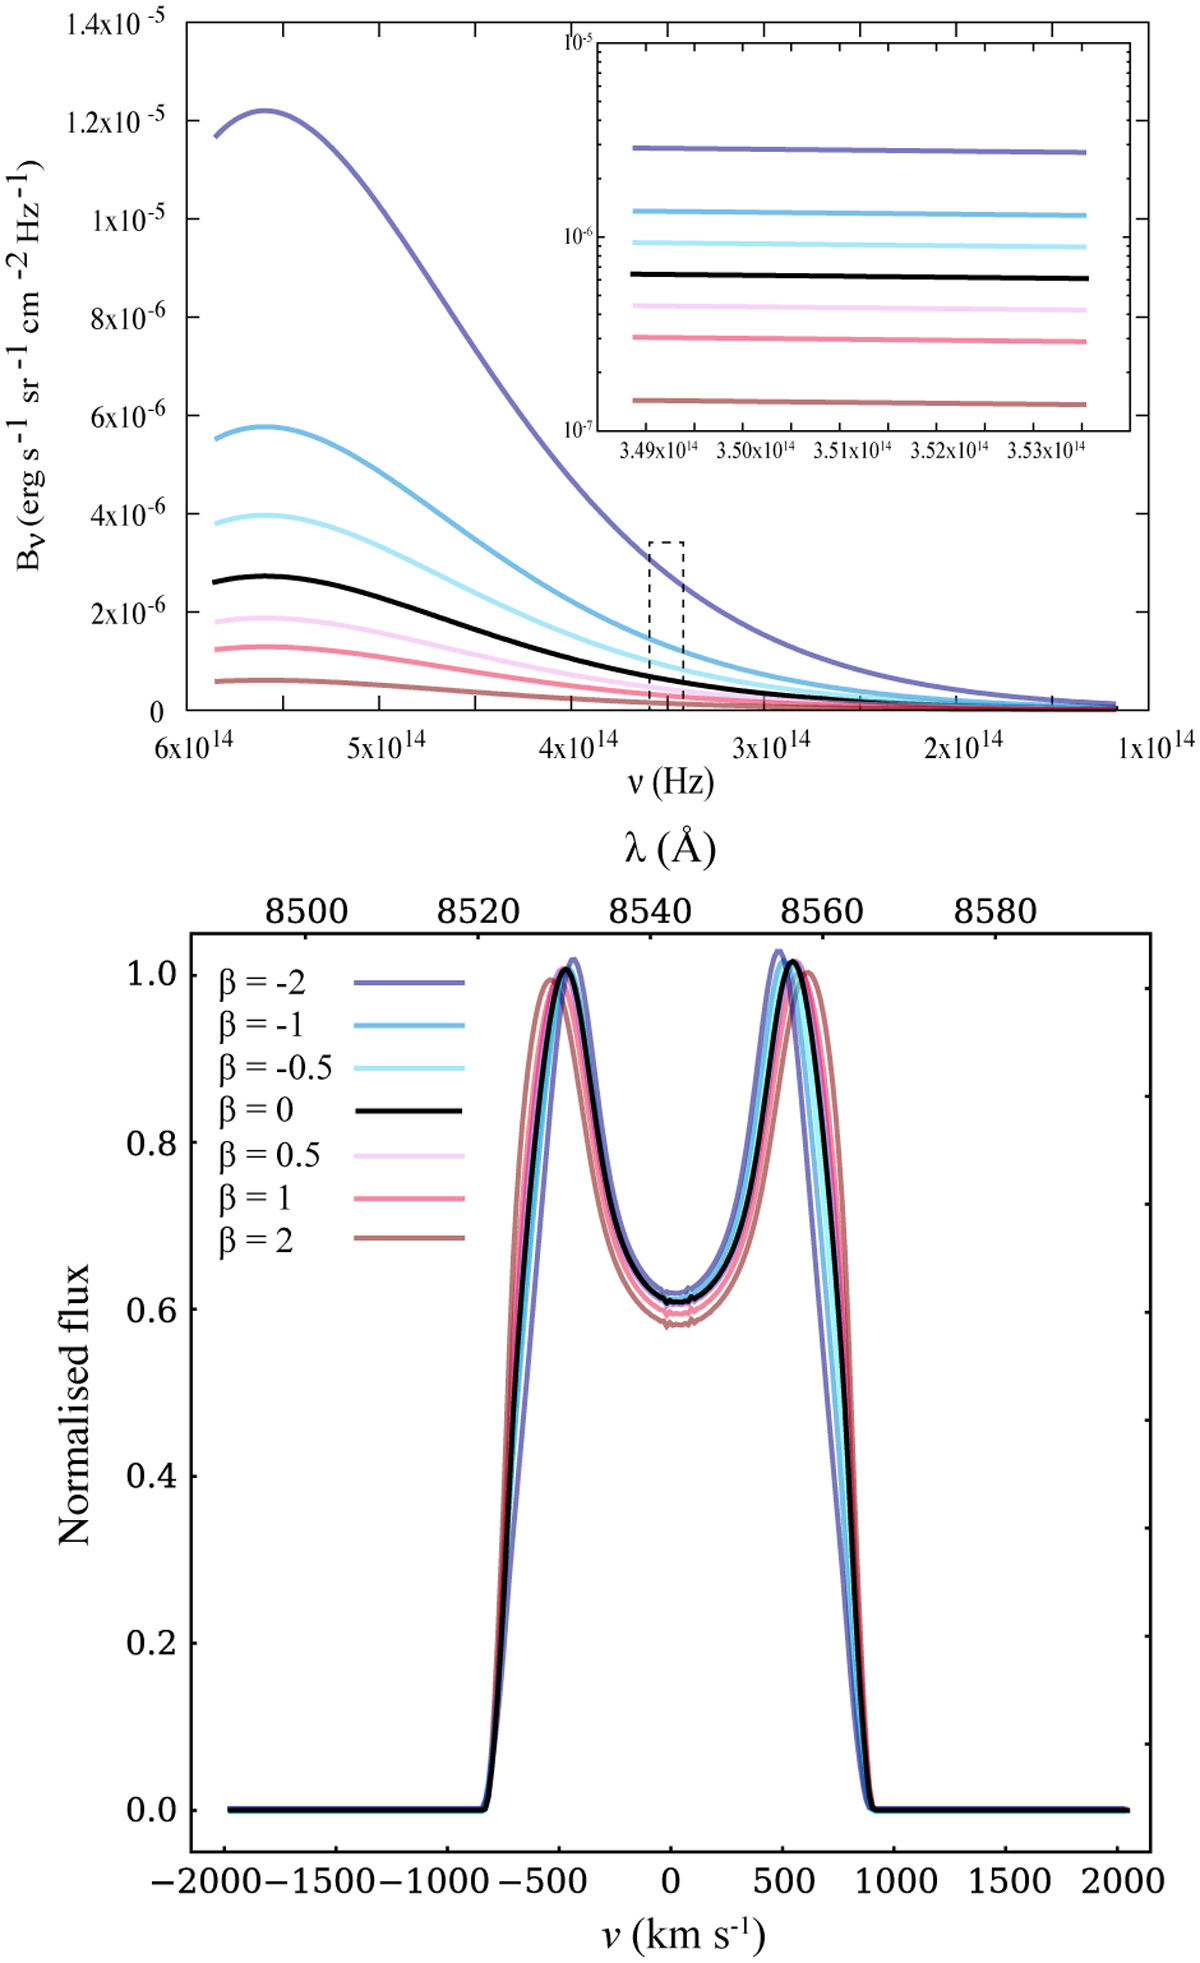
Effect of temperature domain perturbations on the Ca II line profile. Top: Planck functions as a function of frequency. Different colours correspond to different perturbations in the temperature domain (see Eq. B.1). The unperturbed model is denoted by a black line. The inlet shows the close proximity of the Ca II triplet, marked by a dashed rectangle. Bottom: background-normalised λ = 8542 Å Ca II line profiles calculated using the perturbed Bν functions.
Current usage metrics show cumulative count of Article Views (full-text article views including HTML views, PDF and ePub downloads, according to the available data) and Abstracts Views on Vision4Press platform.
Data correspond to usage on the plateform after 2015. The current usage metrics is available 48-96 hours after online publication and is updated daily on week days.
Initial download of the metrics may take a while.