Fig. 7.
Download original image
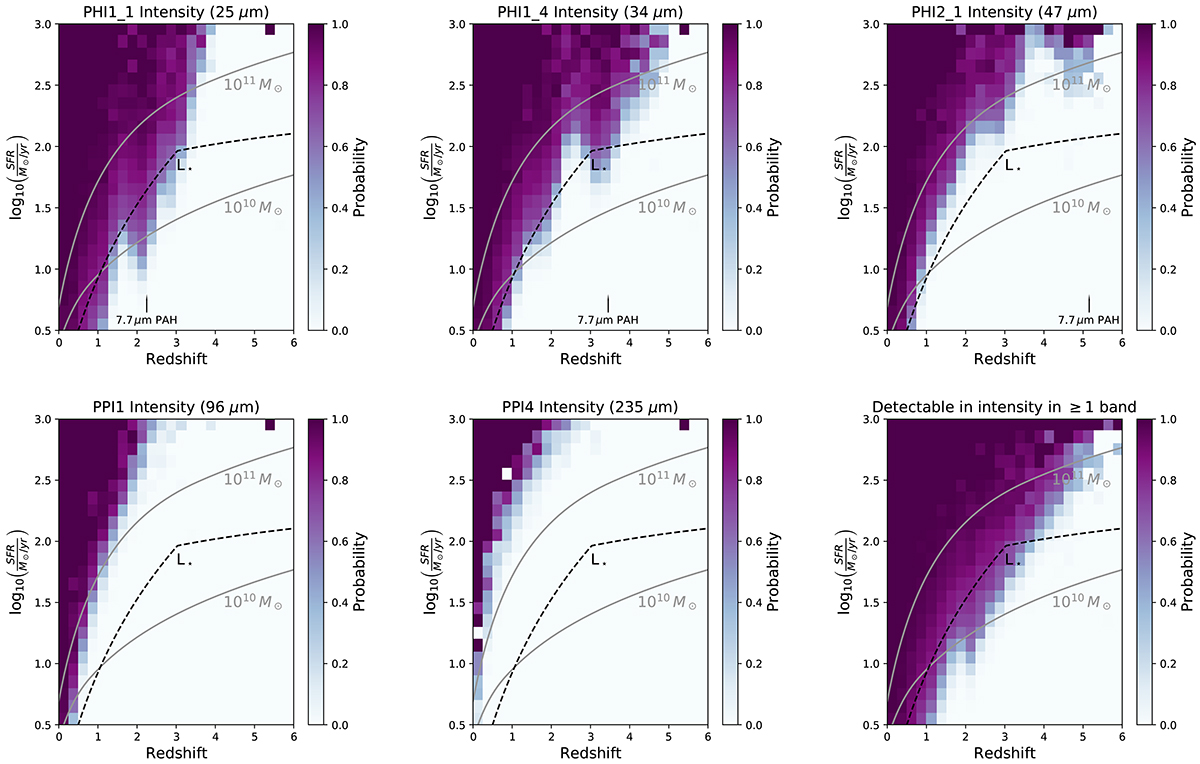
Probability (color-coded) of detecting a galaxy with our basic blind source extractor in an intensity map affected only by confusion as a function of its position in the SFR-z plane. The lower right panel is the probability of detecting the source in at least one band, while the other panels are for a selection of single bands. The two gray tracks show the position of a galaxy exactly on the main-sequence relation (Schreiber et al. 2015) for various stellar masses. The dashed black line shows the evolution of the knee of the infrared luminosity function L⋆ measured by Traina et al. (2024).
Current usage metrics show cumulative count of Article Views (full-text article views including HTML views, PDF and ePub downloads, according to the available data) and Abstracts Views on Vision4Press platform.
Data correspond to usage on the plateform after 2015. The current usage metrics is available 48-96 hours after online publication and is updated daily on week days.
Initial download of the metrics may take a while.