Fig. 6.
Download original image
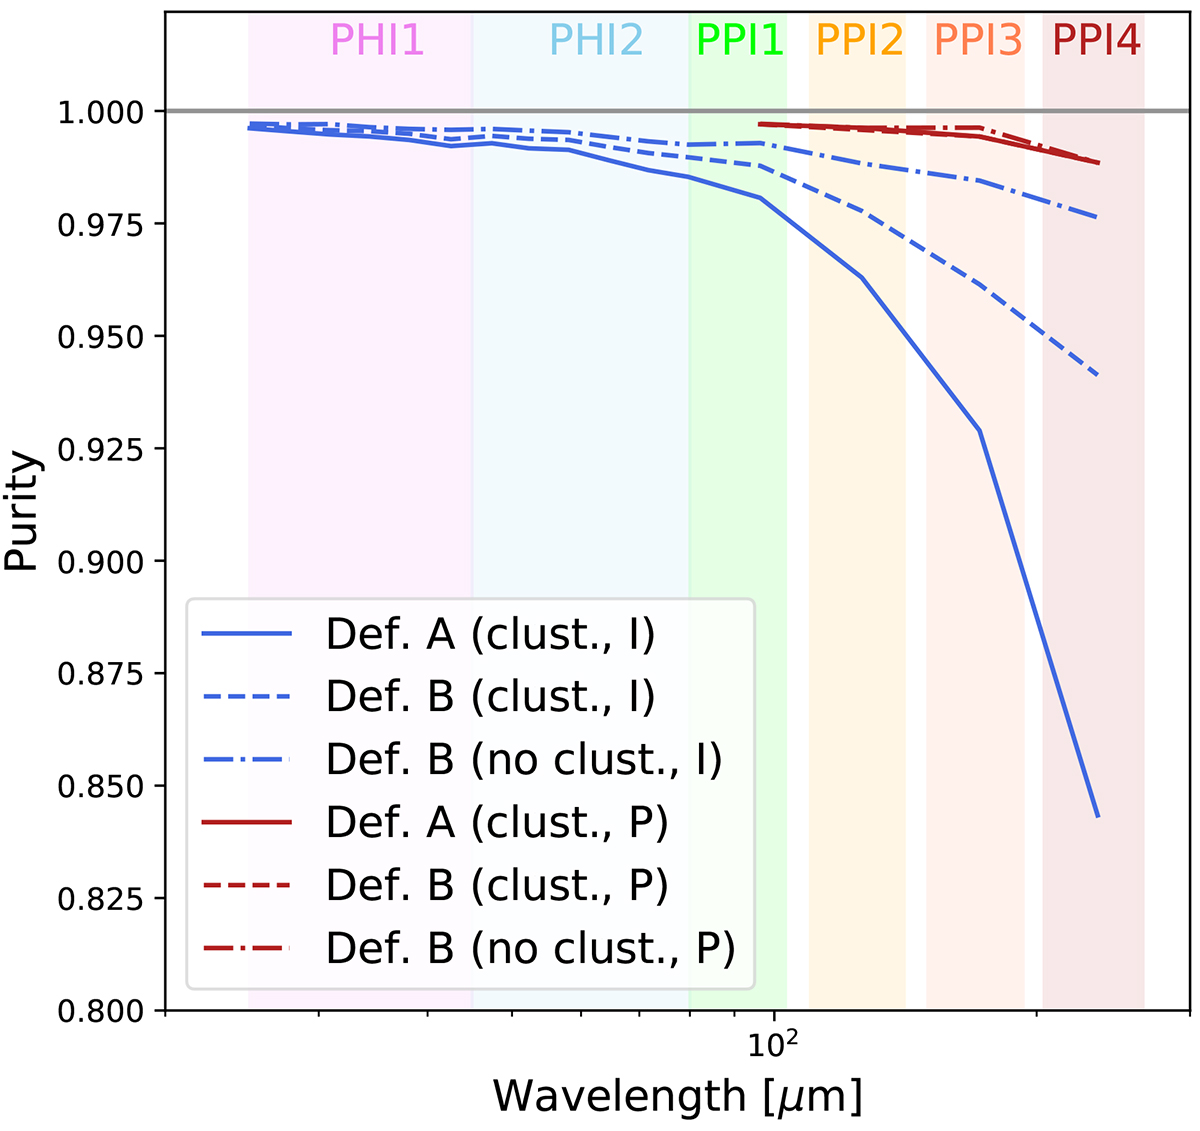
Purity of the sample extracted from the simulated map above the 5σconf threshold in intensity (blue) and polarization (dark red). The solid lines correspond to definition A of purity (see Sect. 3.5), where a source is considered “true” if the brightest galaxy in the beam is at least half of the measured flux. The dashed and dash-dotted lines are corresponding to definition B with and without clustering, respectively. In this second definition, we lower the minimal flux density to consider a source to be true by the flux density excess factor measured in Sect. 4.1. We discuss the intensity in Sect. 4.3 and the polarization in Sect. 5.3.
Current usage metrics show cumulative count of Article Views (full-text article views including HTML views, PDF and ePub downloads, according to the available data) and Abstracts Views on Vision4Press platform.
Data correspond to usage on the plateform after 2015. The current usage metrics is available 48-96 hours after online publication and is updated daily on week days.
Initial download of the metrics may take a while.