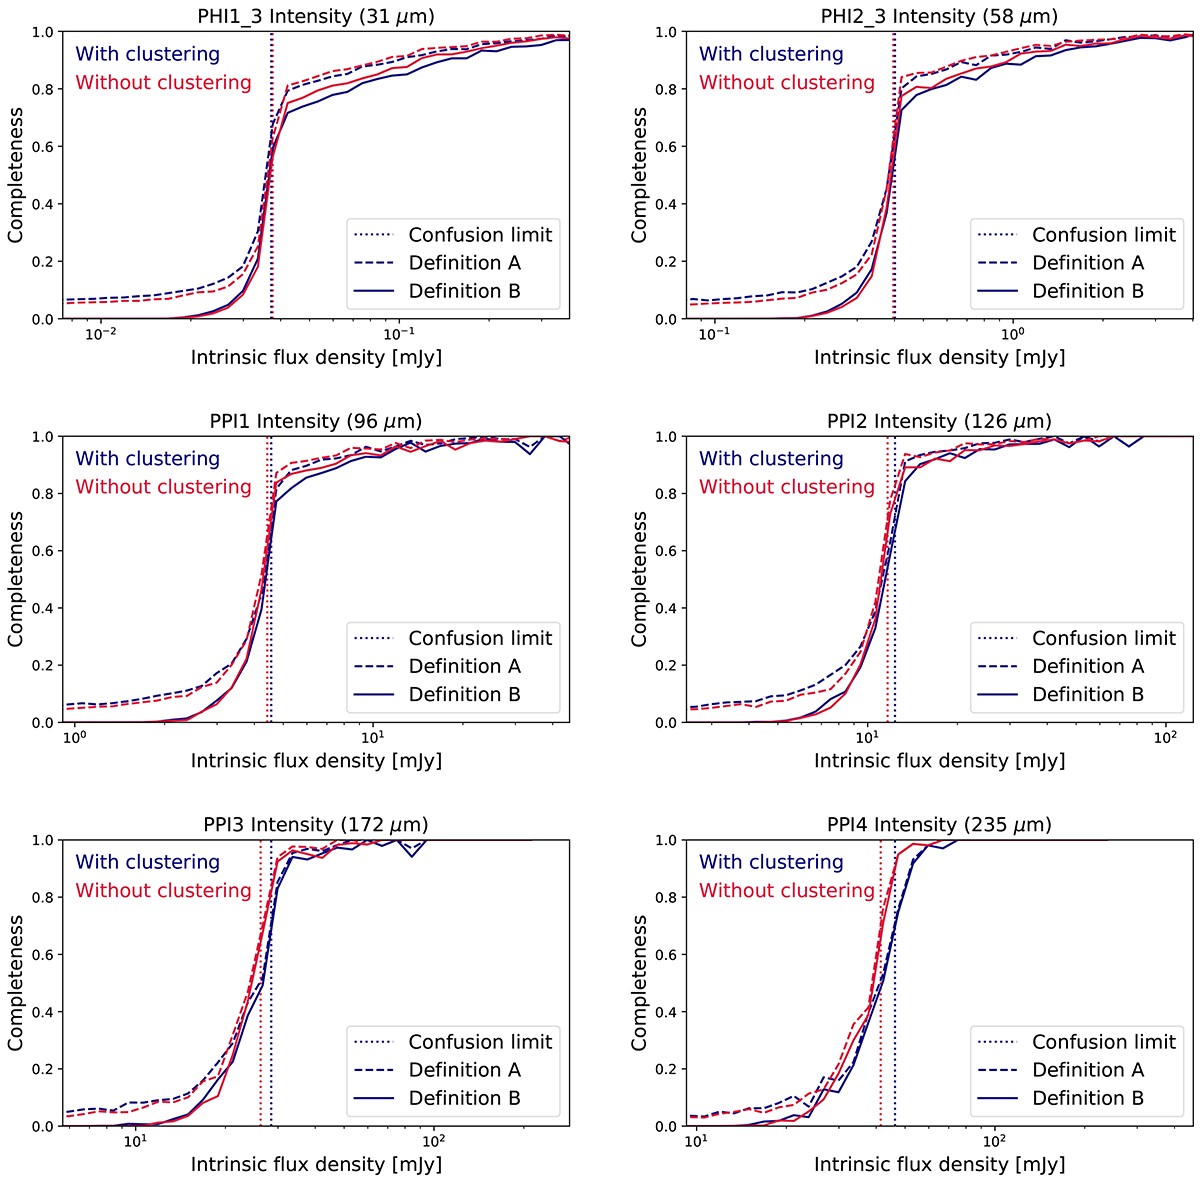
Fig. 4.
Download original image
Completeness as a function of the intrinsic flux density of a galaxy in intensity in the input simulated catalog. The six panels correspond to the same bands as in Fig. 3. The red and blue lines show the results with and without clustering, respectively. The dotted and solid lines correspond to definitions A (a detected galaxy is in the beam of an extracted source) and B (a galaxy is detected only if it is the brightest in the beam of the extracted source) of the completeness described in Sect. 3.5. The vertical dotted line is classical confusion limit computed in Sect. 3.3.
Current usage metrics show cumulative count of Article Views (full-text article views including HTML views, PDF and ePub downloads, according to the available data) and Abstracts Views on Vision4Press platform.
Data correspond to usage on the plateform after 2015. The current usage metrics is available 48-96 hours after online publication and is updated daily on week days.
Initial download of the metrics may take a while.