Fig. 3.
Download original image
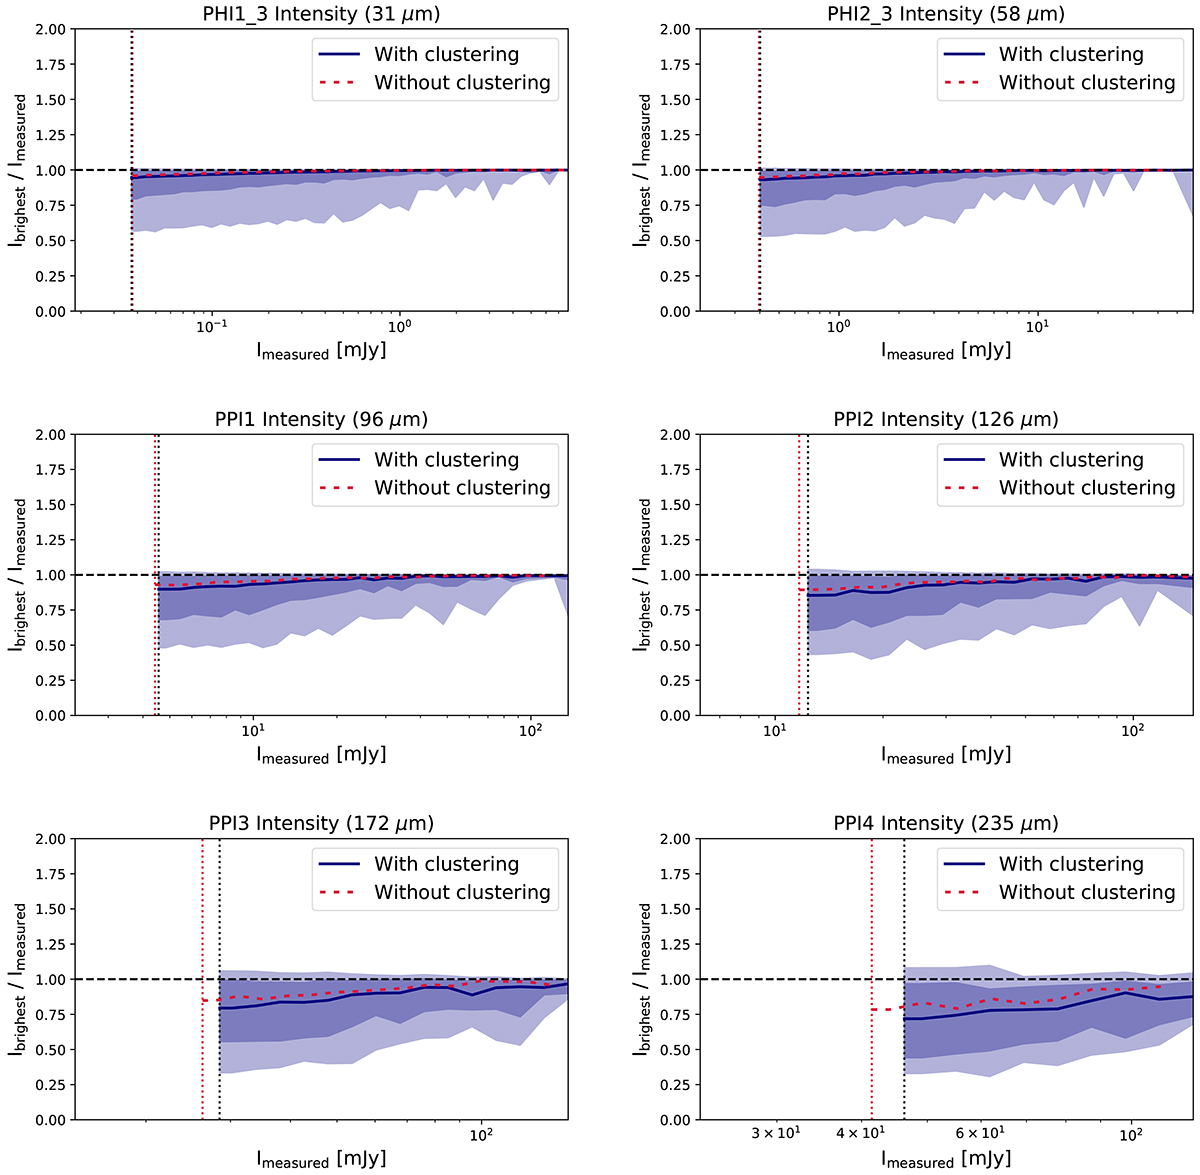
Ratio between the flux density of the brightest simulated galaxy in the beam (see Sect. 3.4) and the measured flux density in the simulated map as a function of the measured flux density. The various panels corresponds to the various PRIMAger bands in intensity (see title above the panel). For PHI bands, we show only the third representative filters. The solid dark blue line is the median value. The dark and light blue areas represent the 16–84% and 2.3–97.7% ranges, respectively, which are equivalent to 1σ and 2σ in the Gaussian case. The horizontal dashed line is the one-to-one ratio. The vertical dotted black and red lines are the classical confusion limit estimated in Sect. 3.3 used as the detection threshold to produce the output catalog with and without clustering, respectively. The dashed red line represents the median flux density ratio in absence of clustering.
Current usage metrics show cumulative count of Article Views (full-text article views including HTML views, PDF and ePub downloads, according to the available data) and Abstracts Views on Vision4Press platform.
Data correspond to usage on the plateform after 2015. The current usage metrics is available 48-96 hours after online publication and is updated daily on week days.
Initial download of the metrics may take a while.