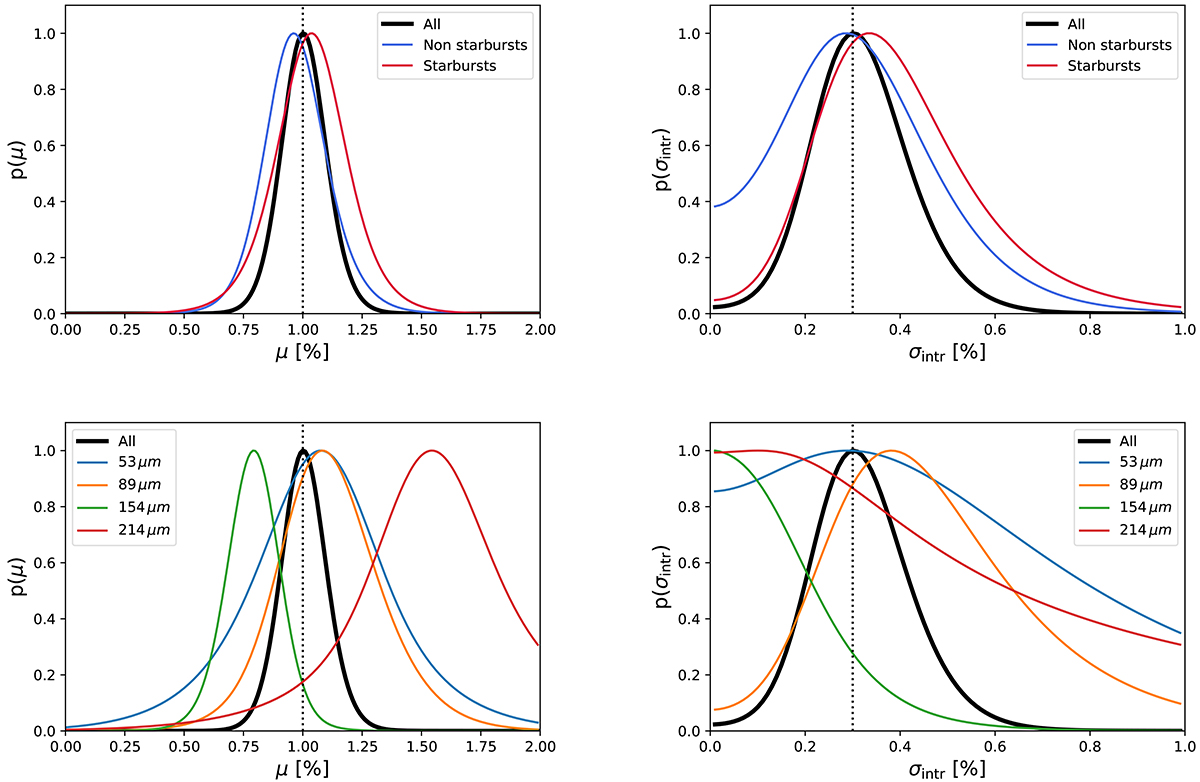
Fig. A.2.
Download original image
Probability density of the mean (left panels) and the standard deviation (right panels) of the polarization fraction determined using the method described in Sect. 2.3. The top and bottom panels show the dependence with the presence of a starburst and the wavelength, respectively. The thick black curve is the result obtained with the full sample and the dotted vertical line is the most probable value. The colored curve are obtained using subsamples.
Current usage metrics show cumulative count of Article Views (full-text article views including HTML views, PDF and ePub downloads, according to the available data) and Abstracts Views on Vision4Press platform.
Data correspond to usage on the plateform after 2015. The current usage metrics is available 48-96 hours after online publication and is updated daily on week days.
Initial download of the metrics may take a while.