Fig. 12.
Download original image
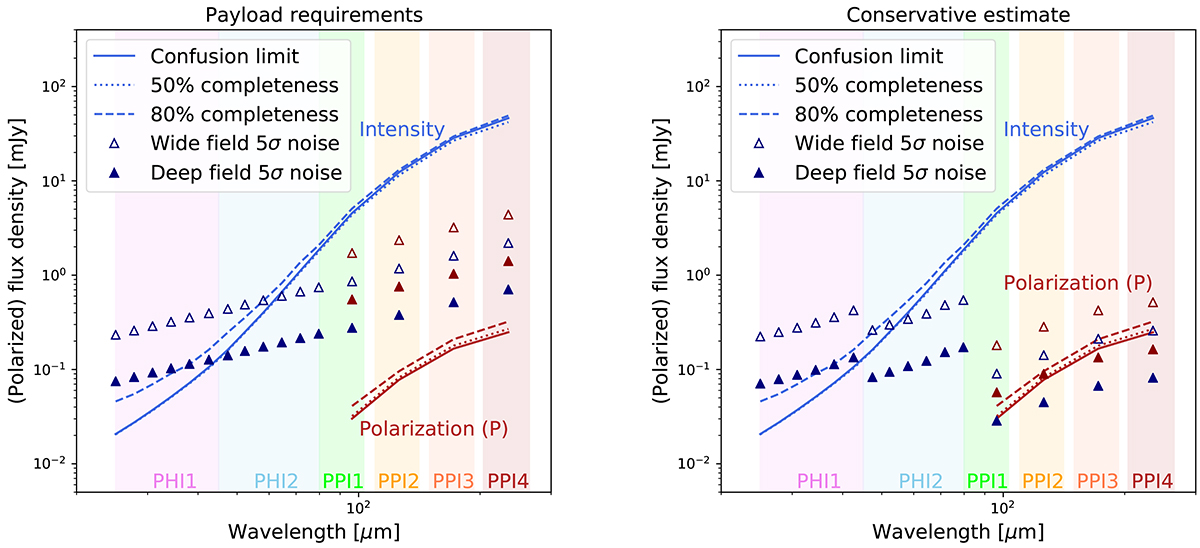
Summary of the maximal depth reachable at the classical confusion limit as a function of wavelength and comparison with the expected PRIMAger instrumental depth. The left panel shows the survey depth for the required payload sensitivity, and the right panel corresponds to the conservative estimated sensitivities predicted by the instrumental teams. The open and filled upward triangles correspond to the 5σ instrumental sensitivity in the wide and deep surveys, respectively. The solid, dotted, and dashed lines are the classical confusion limit, 50%, and 80% completeness flux densities, respectively. The blue symbols correspond to quantities derived from intensity maps (discussed in Sect. 6.1) and the red from polarization maps (see Sect. 6.2). Note that the flux density of a given galaxy is a factor of ∼100 lower in polarization than in intensity, since the mean polarization fraction is 1%.
Current usage metrics show cumulative count of Article Views (full-text article views including HTML views, PDF and ePub downloads, according to the available data) and Abstracts Views on Vision4Press platform.
Data correspond to usage on the plateform after 2015. The current usage metrics is available 48-96 hours after online publication and is updated daily on week days.
Initial download of the metrics may take a while.