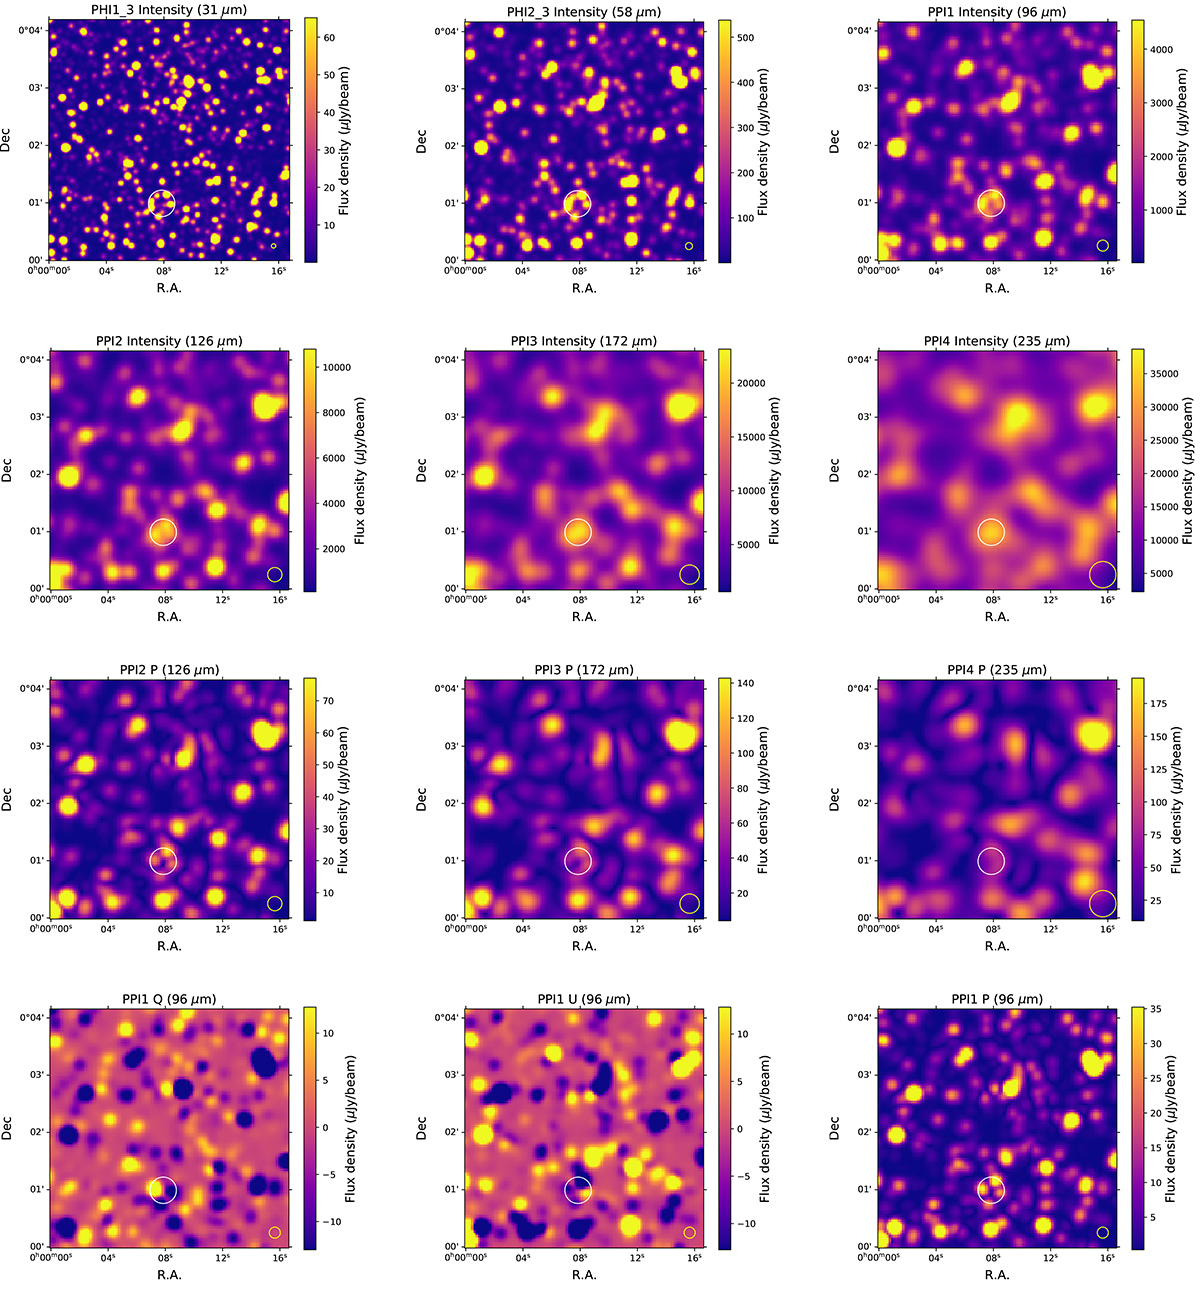
Fig. 1.
Download original image
Cutouts of our simulated PRIMAger noiseless maps produced by SIDES. The first two rows present the intensity maps of the various bands. The third row show the polarized flux (![]() ) maps of the PPI2, PPI3, and PPI4 bands, which can be compared with intensity maps in the same bands in the second row (see discussion in Sect. 2.3). The fourth row contains the Q, U, and P maps in PPI1 band, which illustrates how the Q and U maps combined into the P map. The PPI4 source indicated with a white circle is discussed in Sect. 2.3. The instrumental beam size is indicated using a yellow circle in the bottom right corner.
) maps of the PPI2, PPI3, and PPI4 bands, which can be compared with intensity maps in the same bands in the second row (see discussion in Sect. 2.3). The fourth row contains the Q, U, and P maps in PPI1 band, which illustrates how the Q and U maps combined into the P map. The PPI4 source indicated with a white circle is discussed in Sect. 2.3. The instrumental beam size is indicated using a yellow circle in the bottom right corner.
Current usage metrics show cumulative count of Article Views (full-text article views including HTML views, PDF and ePub downloads, according to the available data) and Abstracts Views on Vision4Press platform.
Data correspond to usage on the plateform after 2015. The current usage metrics is available 48-96 hours after online publication and is updated daily on week days.
Initial download of the metrics may take a while.