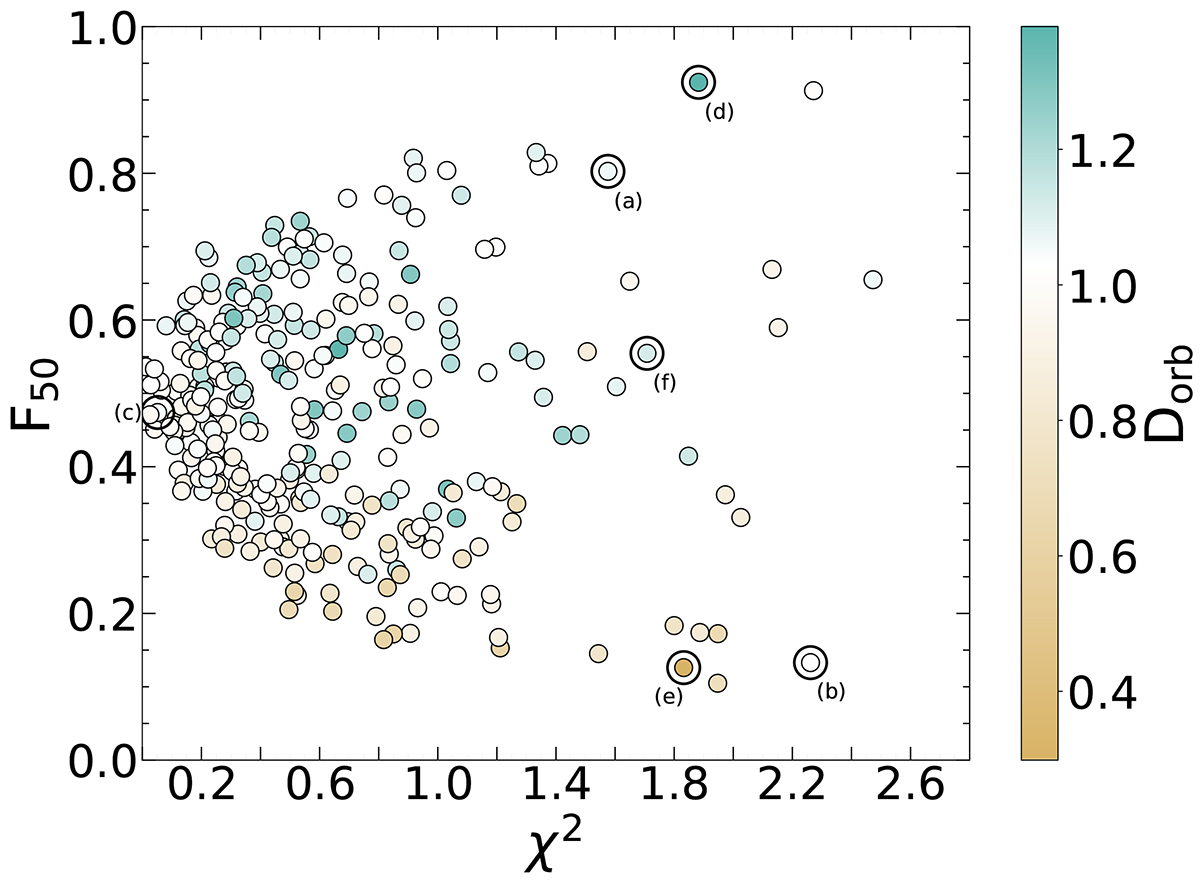
Fig. A.1.
Download original image
Orbit-to-orbit hardness variability relative to the hardness average trend. Each point represents an individual binary orbit from our sample (Sect. 4.1), with F50 (Eq. 3) values plotted against χ2 (Eq. A.1). Dorb coefficient (Eq. A.3) is colour-coded. We highlight the binary orbits shown in Fig. 7 with a black circle. See the main text for details.
Current usage metrics show cumulative count of Article Views (full-text article views including HTML views, PDF and ePub downloads, according to the available data) and Abstracts Views on Vision4Press platform.
Data correspond to usage on the plateform after 2015. The current usage metrics is available 48-96 hours after online publication and is updated daily on week days.
Initial download of the metrics may take a while.