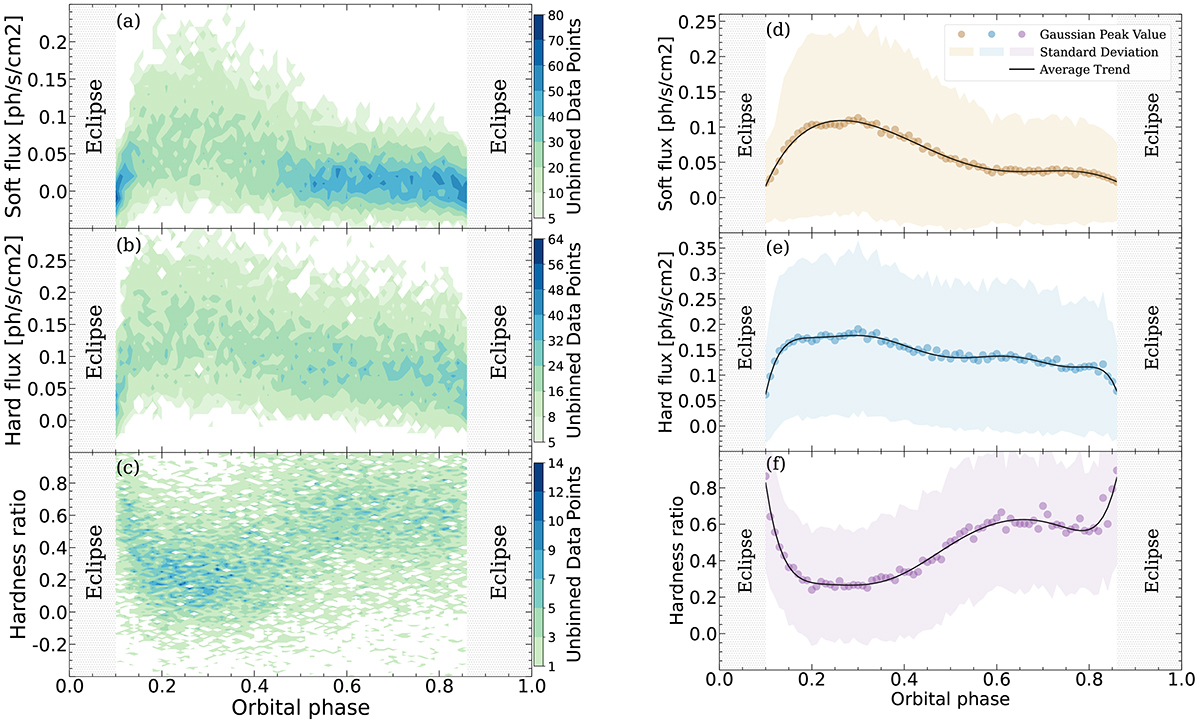
Fig. 3.
Download original image
Histograms and average trends of the MAXI/GSC dataset. Left: 2D histograms showing the unbinned MAXI/GSC dataset, depicting the flux in the 2−4 keV (soft band; top) and 4−10 keV energy range (hard band; middle), and the derived hardness ratio (bottom), calculated as explained in Sect. 3. The number of unbinned data points is colour-coded: lighter shades denote smaller values and darker shades indicate higher ones. Right: Average trends and their associated standard deviations derived from fits to the 2D histograms. Each shaded region is colour-coded, and the same code is used in Figs. 7 and B.1. For further details, we refer to the main text.
Current usage metrics show cumulative count of Article Views (full-text article views including HTML views, PDF and ePub downloads, according to the available data) and Abstracts Views on Vision4Press platform.
Data correspond to usage on the plateform after 2015. The current usage metrics is available 48-96 hours after online publication and is updated daily on week days.
Initial download of the metrics may take a while.