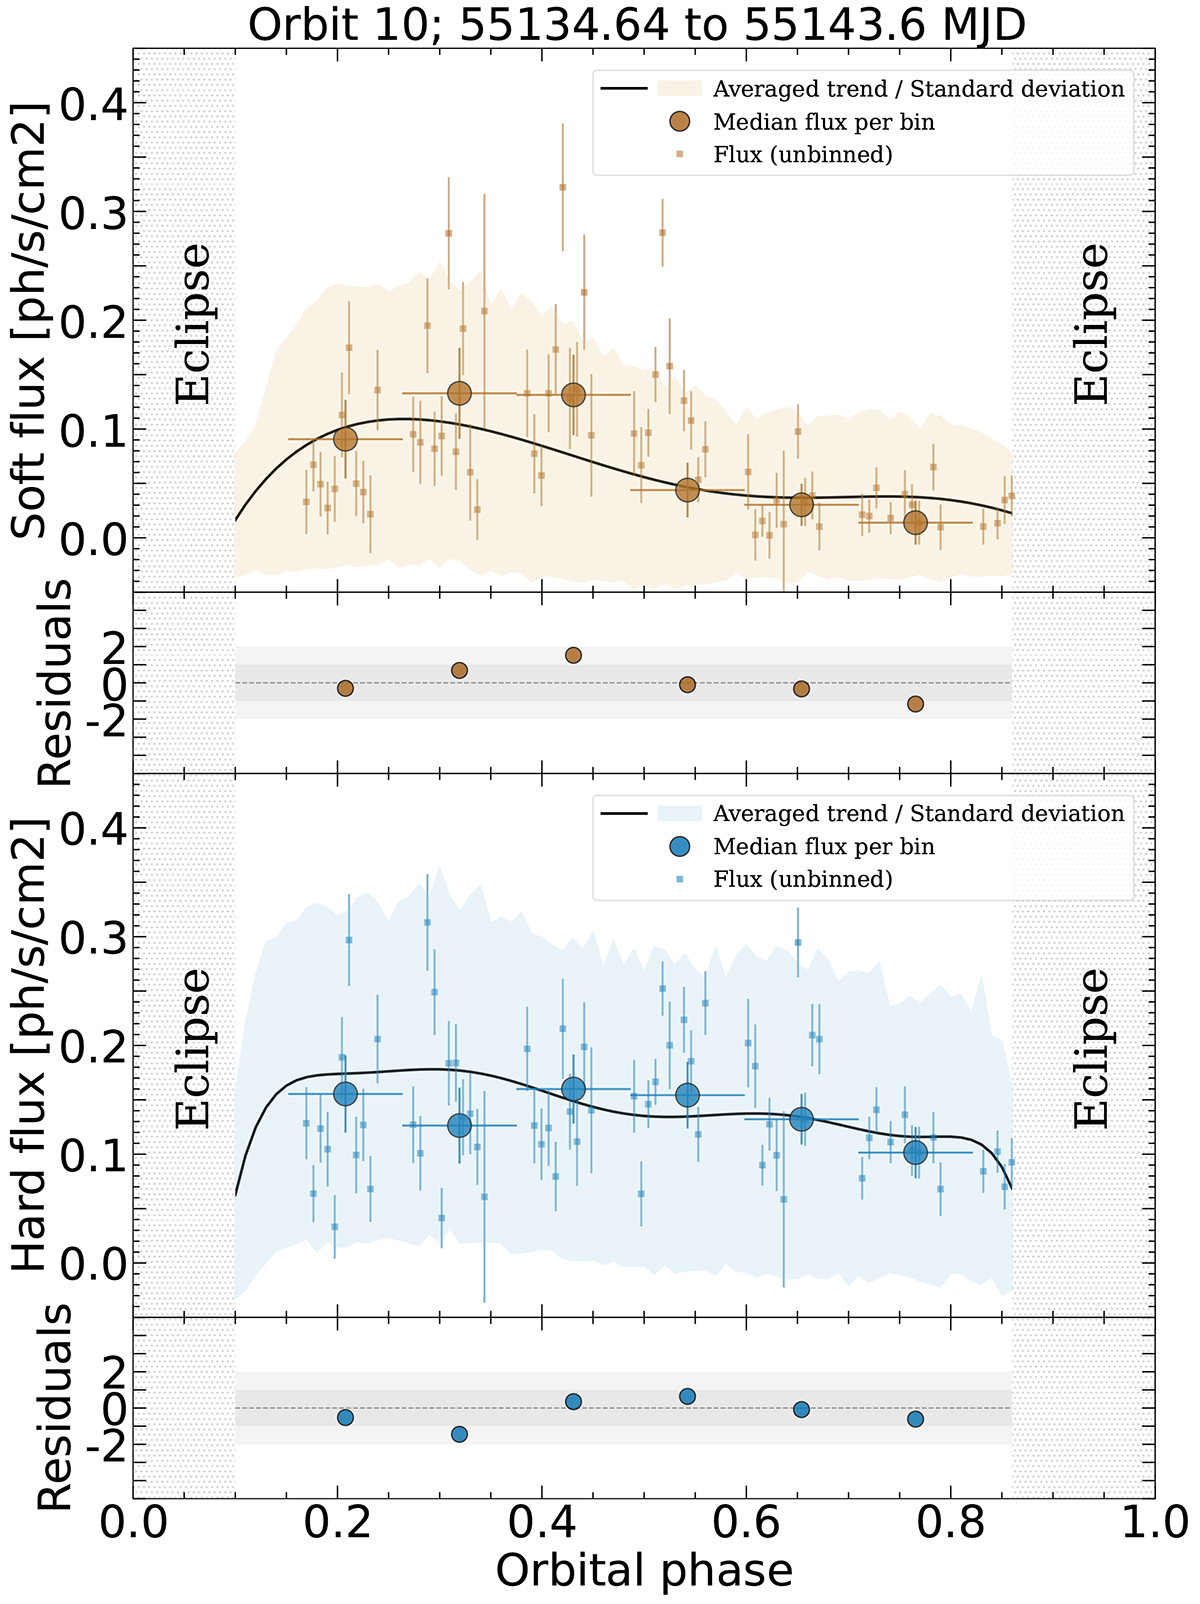
Fig. B.1.
Download original image
MAXI/GSC light curve for both the soft (top, yellow points) and hard (bottom, blue points) energy bands. Small squares represent unbinned flux data and large circles the median flux values per phase bin, each with their respective uncertainties. The bin size is indicated by the horizontal error bars. As in Fig. 3, the average trend is also shown as a solid black line and the standard deviation as a shaded area.
Current usage metrics show cumulative count of Article Views (full-text article views including HTML views, PDF and ePub downloads, according to the available data) and Abstracts Views on Vision4Press platform.
Data correspond to usage on the plateform after 2015. The current usage metrics is available 48-96 hours after online publication and is updated daily on week days.
Initial download of the metrics may take a while.