Fig. 9
Download original image
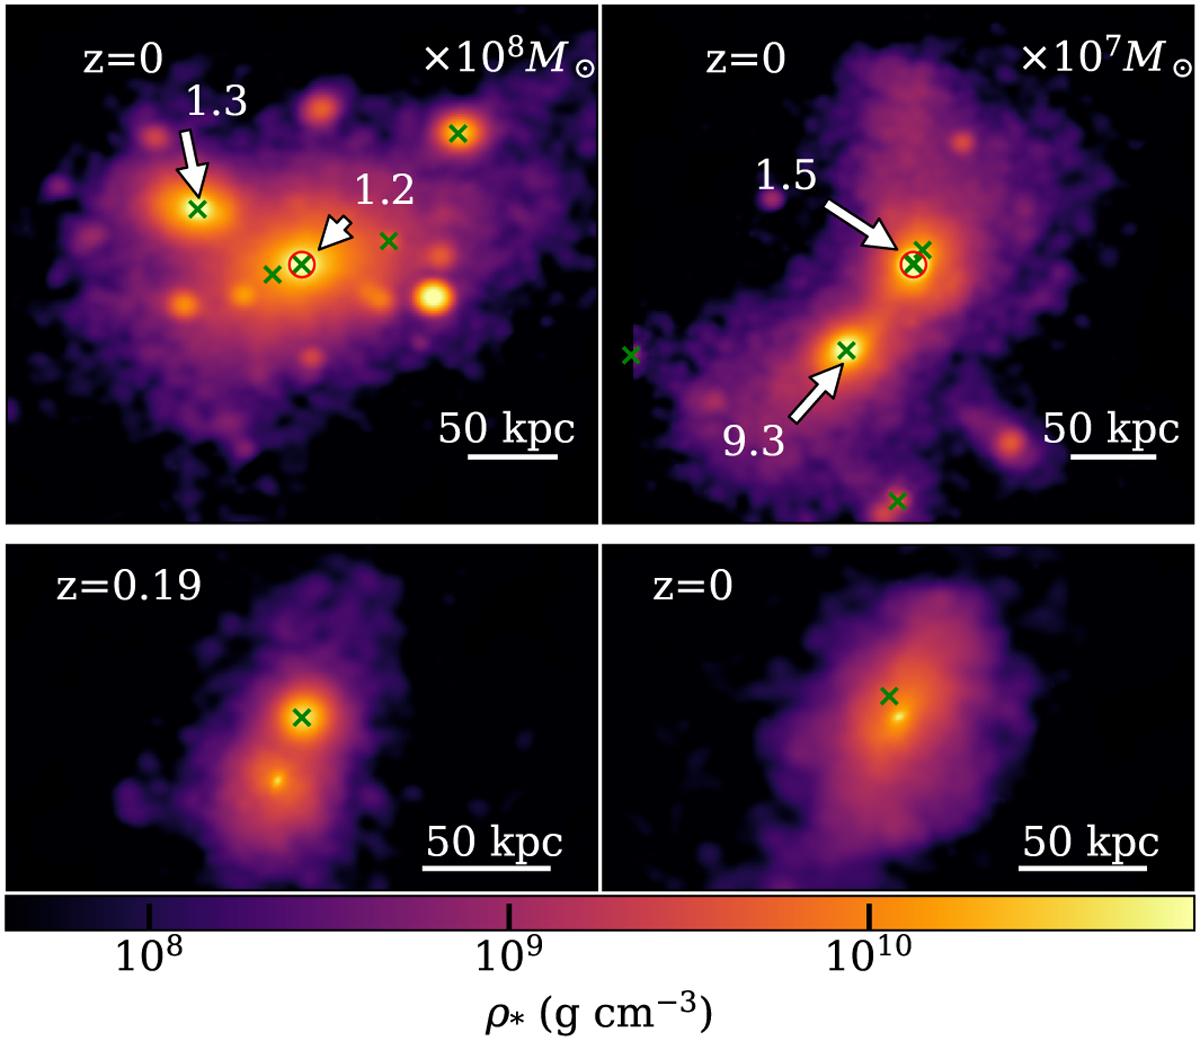
Stellar density maps along the z-axis with depth of 350 kpc (upper row) and 260 kpc (bottom row) of the massive sub-halos having a large separation between sub-halo centre and the associated BH in the CosmoBox simulation, using the DYNFRIC model (blue diamonds in the corresponding plot in Fig. 8, for log10(M*/M⊙) > 10), at redshift z = 0. BHs are marked by green crosses. Upper panels: two close encounters between structures. The halo centre is identified as a red circle. The arrows link to the values of the BH masses (in units as specified in the label). In both the left and right panels, the most massive BH belongs to the off-centre substructure. Bottom panels: a merger event between two substructures at redshift z = 0.19 (left panel) and the resulting merged halo at z = 0 (right panel). The plot on the right side captures an off- centre BH while sinking toward the halo centre.
Current usage metrics show cumulative count of Article Views (full-text article views including HTML views, PDF and ePub downloads, according to the available data) and Abstracts Views on Vision4Press platform.
Data correspond to usage on the plateform after 2015. The current usage metrics is available 48-96 hours after online publication and is updated daily on week days.
Initial download of the metrics may take a while.