Fig. 6
Download original image
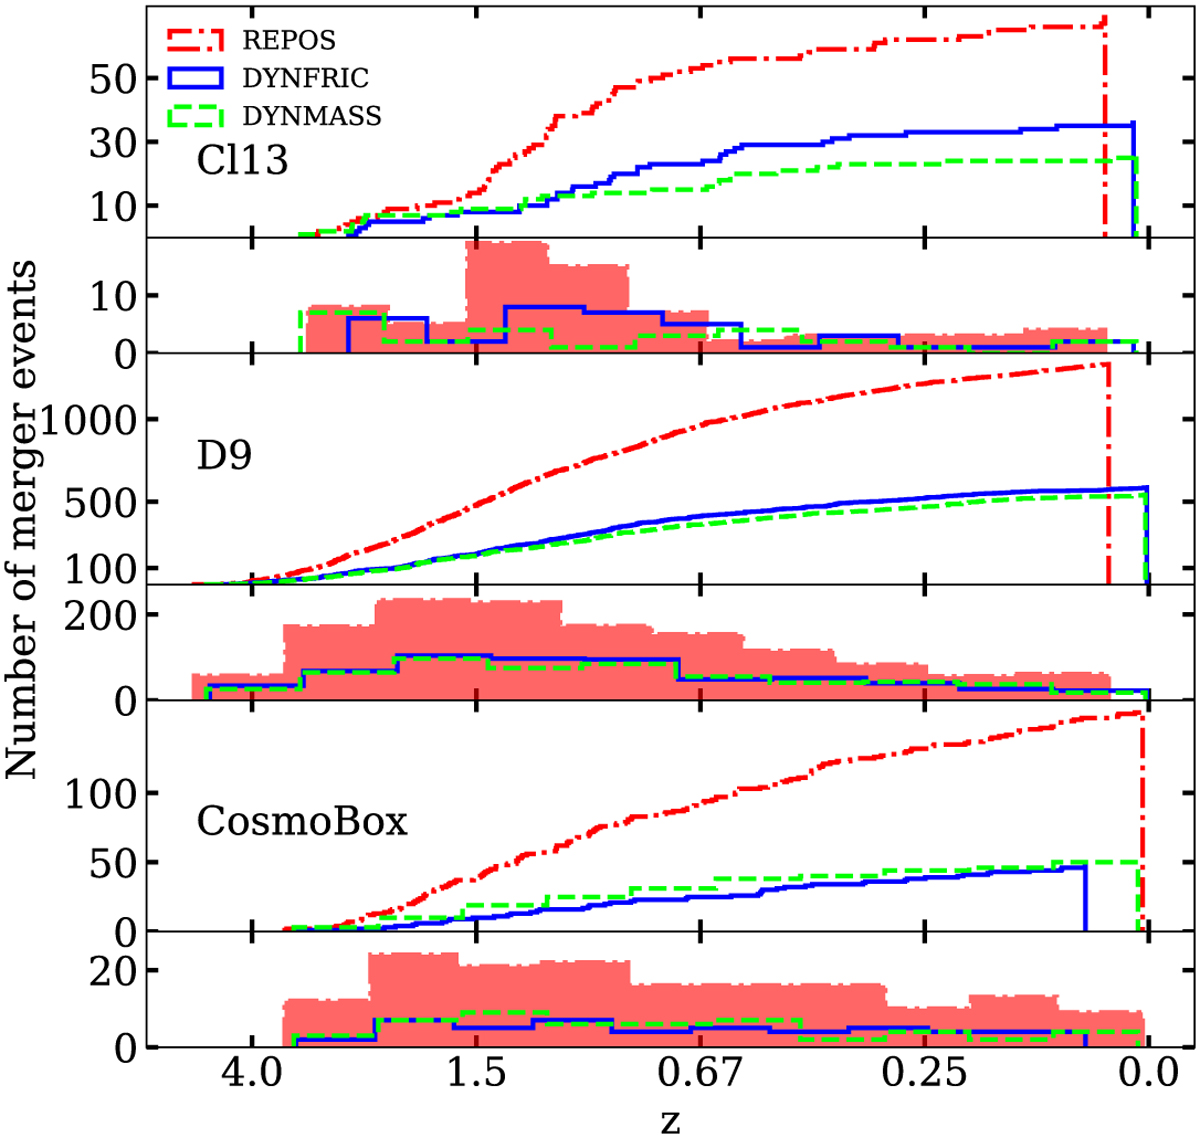
Cumulative and differential distributions of the number of merger events as a function of redshift. Cl13, D9, and CosmoBox are in the first, second, and third rows, respectively. The REPOS simulation results are marked with a dash-dotted red line (with a shaded area marking the differential distributions), the DYNFRIC simulations with a blue solid line and the DYNMASS simulations with a dashed green line. The curves stop at the redshift corresponding to the occurrence of last merger event.
Current usage metrics show cumulative count of Article Views (full-text article views including HTML views, PDF and ePub downloads, according to the available data) and Abstracts Views on Vision4Press platform.
Data correspond to usage on the plateform after 2015. The current usage metrics is available 48-96 hours after online publication and is updated daily on week days.
Initial download of the metrics may take a while.