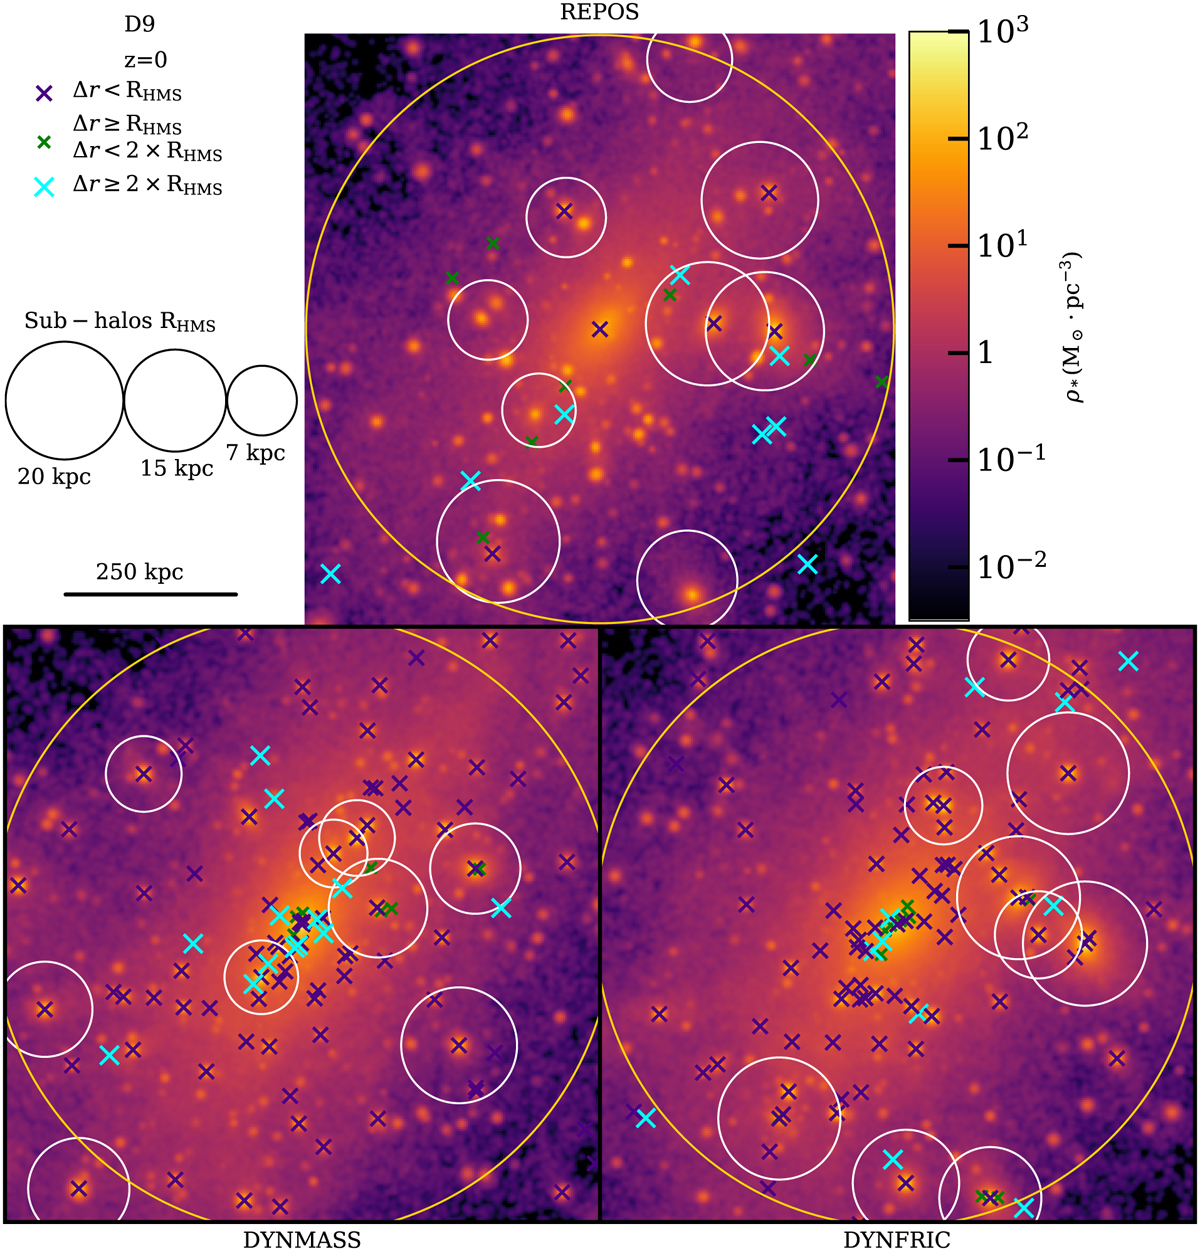
Fig. 5
Download original image
Stellar density maps along the z-axis with a depth of 1 Mpc centred on the most massive halo of D9 at z = 0 in the REPOS (top), DYNMASS (bottom left), and DYNFRIC (bottom right) simulations. The panels are all 1 Mpc on a side. In each panel, we plot with dark-blue crosses the BHs located within the RHMS of the associated sub-halo (the same criterion adopted in Sect. 5.1). BHs lying between RHMS and 2RHMS of the closest sub-halo are indicated with green crosses, while wandering BHs (defined as those located beyond 2RHMS of the closest sub-halo) are shown as light-blue crosses. The values of RHMS of the ten most massive structures correspond to the radii of the circles, each centre on the position of the corresponding sub-halo. The RHMS of the BCG, in yellow, corresponds to the physical size of the yellow circle. The legend in the upper left panel of the plot shows the scaling size of the other sub-structures in the region, marked in white.
Current usage metrics show cumulative count of Article Views (full-text article views including HTML views, PDF and ePub downloads, according to the available data) and Abstracts Views on Vision4Press platform.
Data correspond to usage on the plateform after 2015. The current usage metrics is available 48-96 hours after online publication and is updated daily on week days.
Initial download of the metrics may take a while.