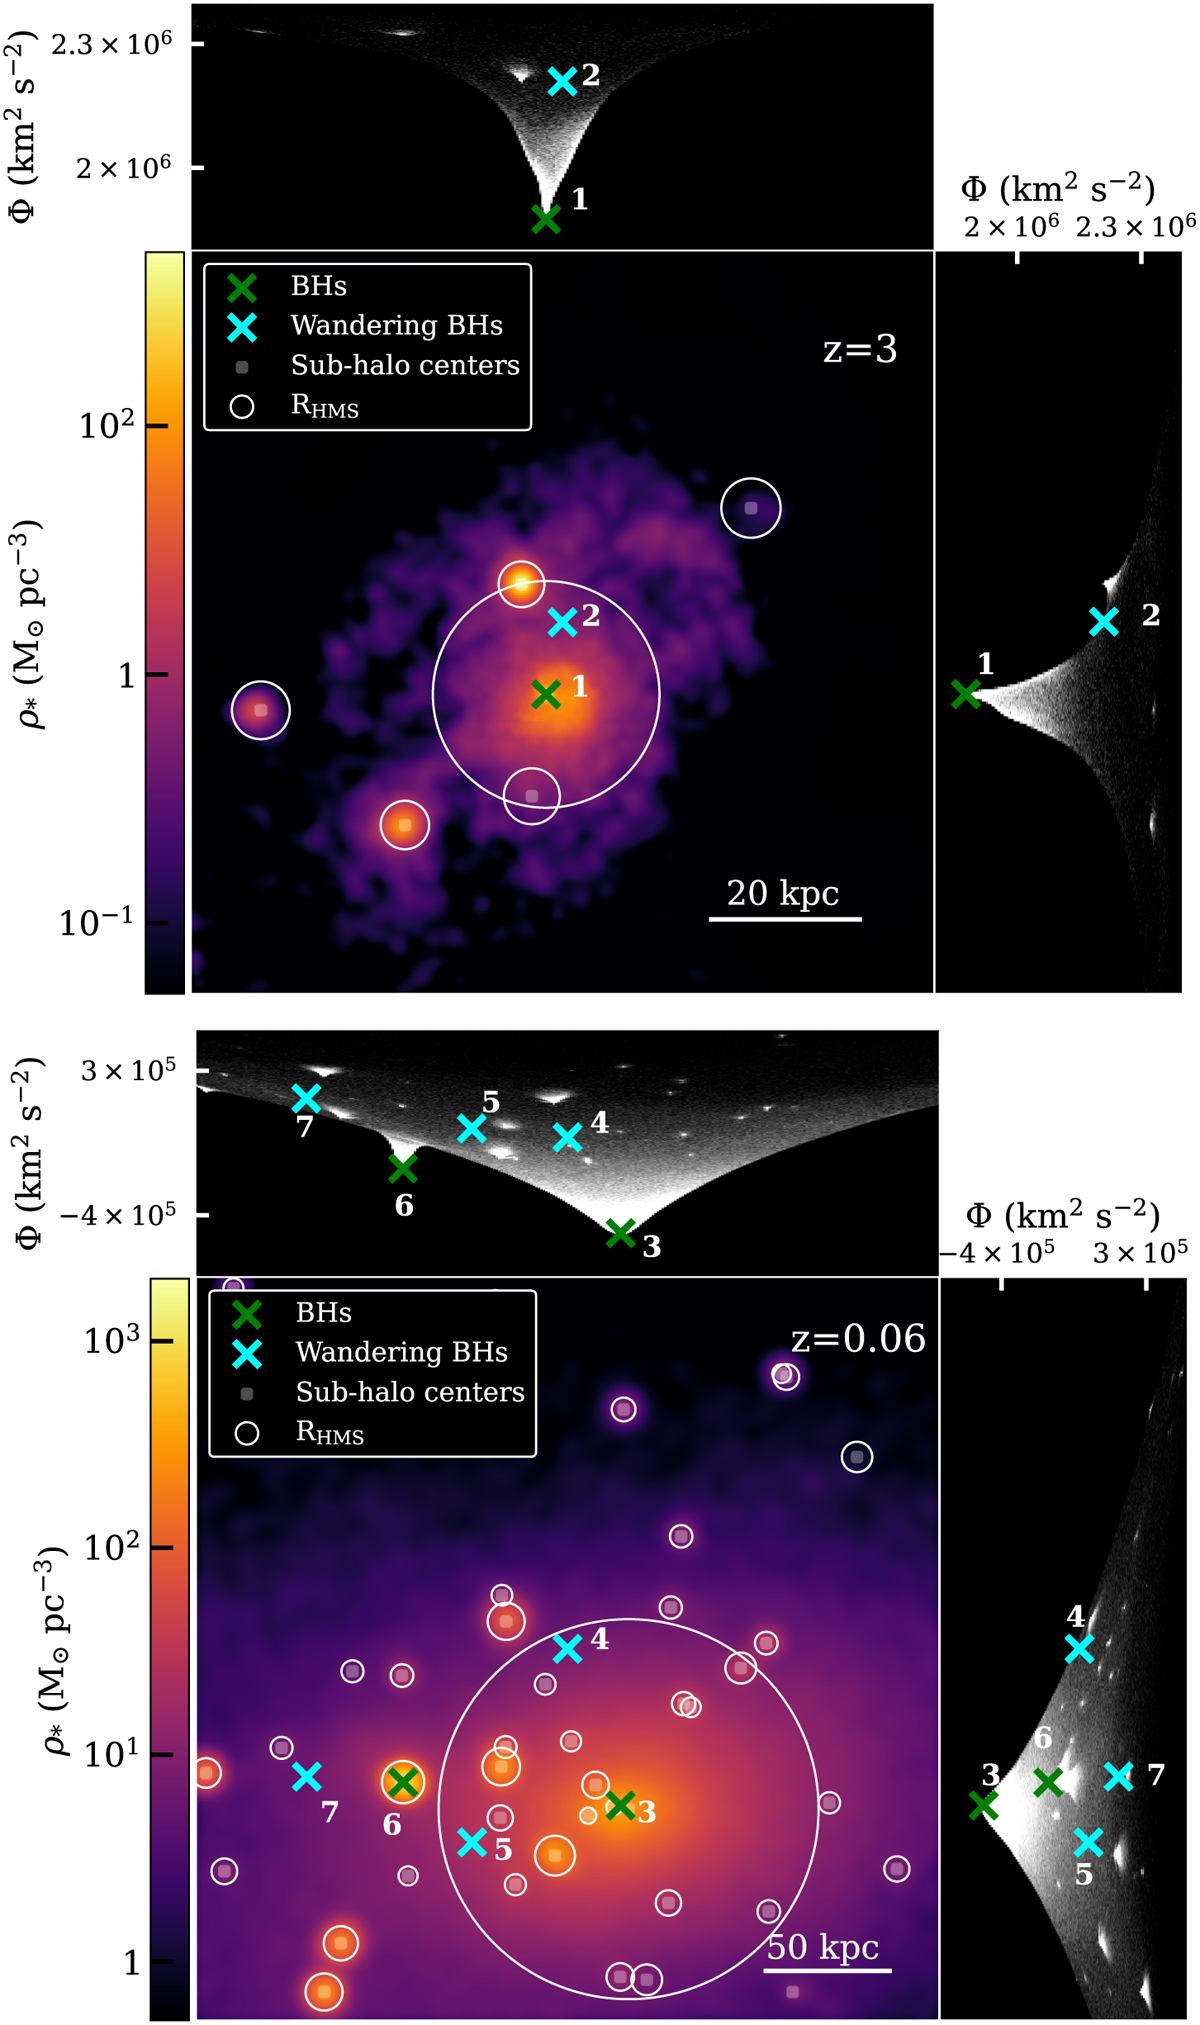
Fig. 4
Download original image
Stellar density projection along the z-axis with depths of 100 kpc (top) and 300 kpc (bottom), centred on the position of a wandering BH at redshiſt z = 3 (tagged as BH 2; left panel), and of a wandering BH at z = 0.06 (tagged as BH 4; right panel) in the D9 simulation using the REPOS scheme. In both panels, the cyan crosses identify the wandering BHs, while the green crosses identify the BHs centred in their host. We show sub-halo centres as white shaded dots, with the white circles indicating the corresponding RHMS. On the top and on the right of each panel we show the gravitational potential Φ of all the star particles (light white dots) and of the BHs (crosses) in the field, projected along the two orthogonal directions.
Current usage metrics show cumulative count of Article Views (full-text article views including HTML views, PDF and ePub downloads, according to the available data) and Abstracts Views on Vision4Press platform.
Data correspond to usage on the plateform after 2015. The current usage metrics is available 48-96 hours after online publication and is updated daily on week days.
Initial download of the metrics may take a while.