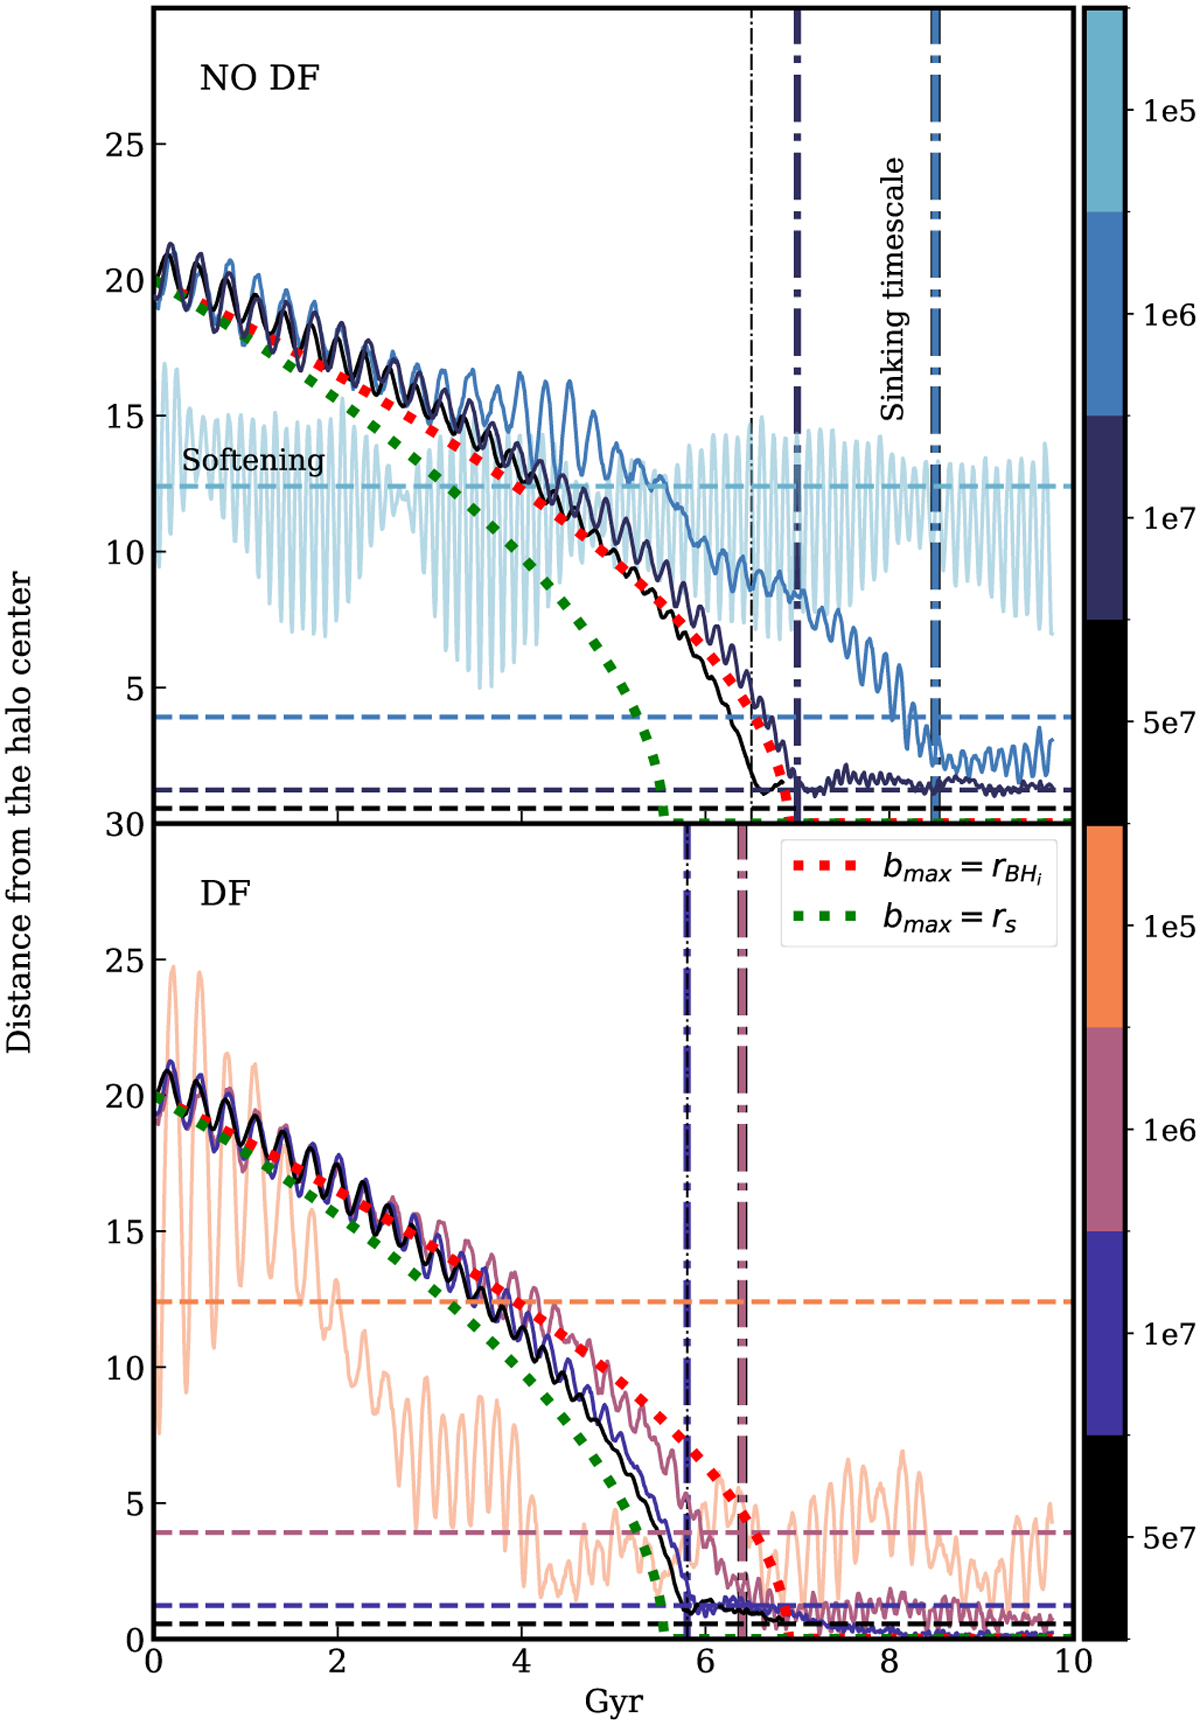
Fig. B.1
Download original image
Sinking timescales for a BH orbiting in a NFW DM halo. We plot the distance to the halo centre found through the shrinking sphere algorithm (Power et al. 2003) as a function of time. We plot the results from numerical simulation without any correction to the BH dynamics (top panel) and with the DF implementation introduced in Sect. 2.1 (bottom panel). The colourmap indicates the number of particles sampling the halo such that darker lines refer to higher numerical resolution. The dashed-dotted vertical lines are indicative sinking timescales and horizontal lines report the softening lengths, both are colour-coded with the simulation they refer to. The dotted lines are the analytical preditions for an infalling BH into a NFW halo, choosing the same BH and halo parameter of the numerical simulations, but varying the maximum impact paramter from bmax = 20 (red) and bmax = 80 (green).
Current usage metrics show cumulative count of Article Views (full-text article views including HTML views, PDF and ePub downloads, according to the available data) and Abstracts Views on Vision4Press platform.
Data correspond to usage on the plateform after 2015. The current usage metrics is available 48-96 hours after online publication and is updated daily on week days.
Initial download of the metrics may take a while.