Fig. 11
Download original image
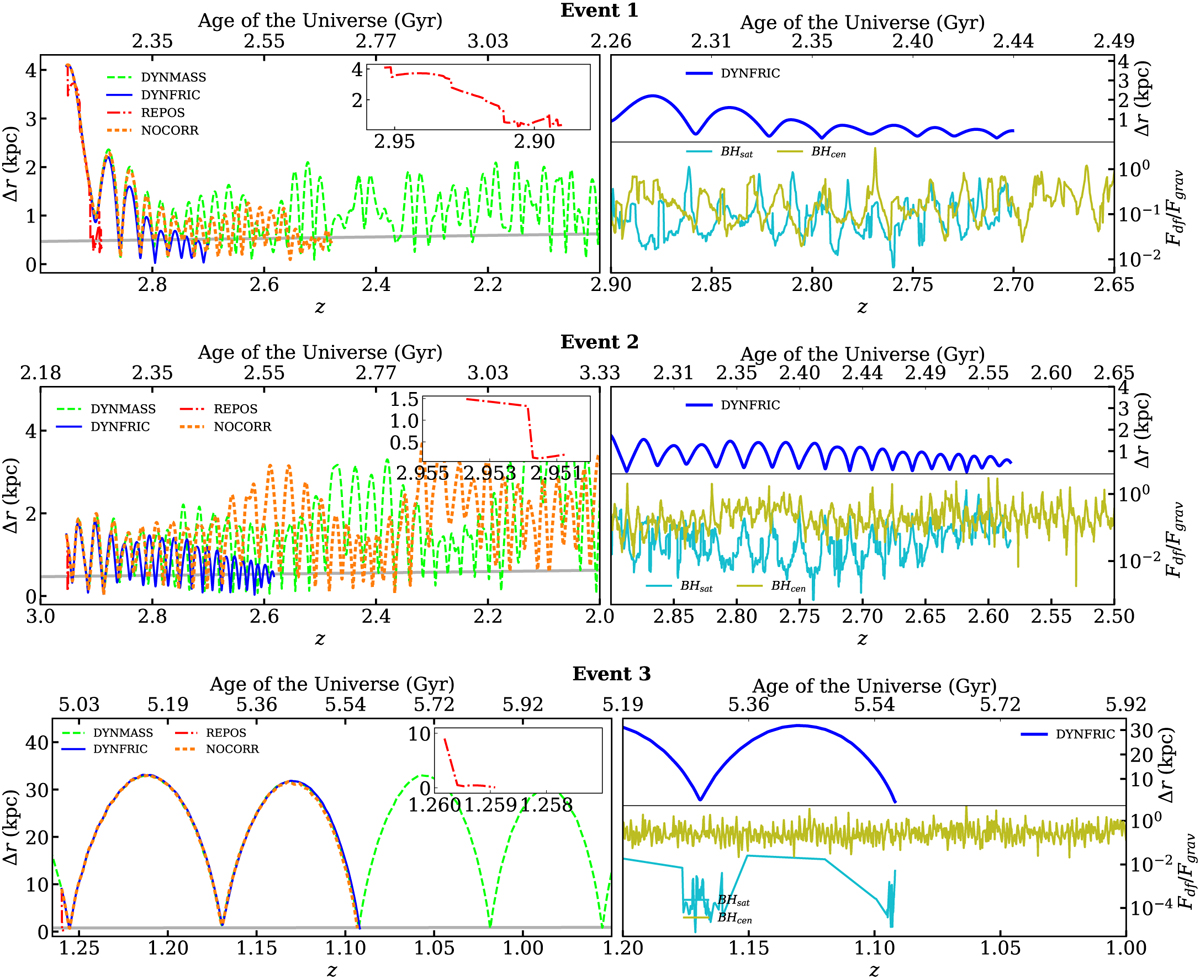
Left column: evolution of the distance between the central and the satellite BH in Event 1 (top), Event 2 (central), Event 3 (bottom). The dashed green line displays the evolution using the dynamical mass scheme (DYNMASS), the blue solid line is for the DF scheme (DYNFRIC), the dash-dotted red line for the repositioning (REPOS), and the densely dashed orange line is for the case without any sub-resolution prescription (NOCORR). The horizontal grey solid line represents the distance threshold which is necessary for the merger event dmerg to happen. Right column: evolution of the distance between the BHs for the DYNFRIC case (top panel) and ratio between the DF and gravitational forces during each event.
Current usage metrics show cumulative count of Article Views (full-text article views including HTML views, PDF and ePub downloads, according to the available data) and Abstracts Views on Vision4Press platform.
Data correspond to usage on the plateform after 2015. The current usage metrics is available 48-96 hours after online publication and is updated daily on week days.
Initial download of the metrics may take a while.